Implied Volatility Rank (Think or Swim)
$0.00
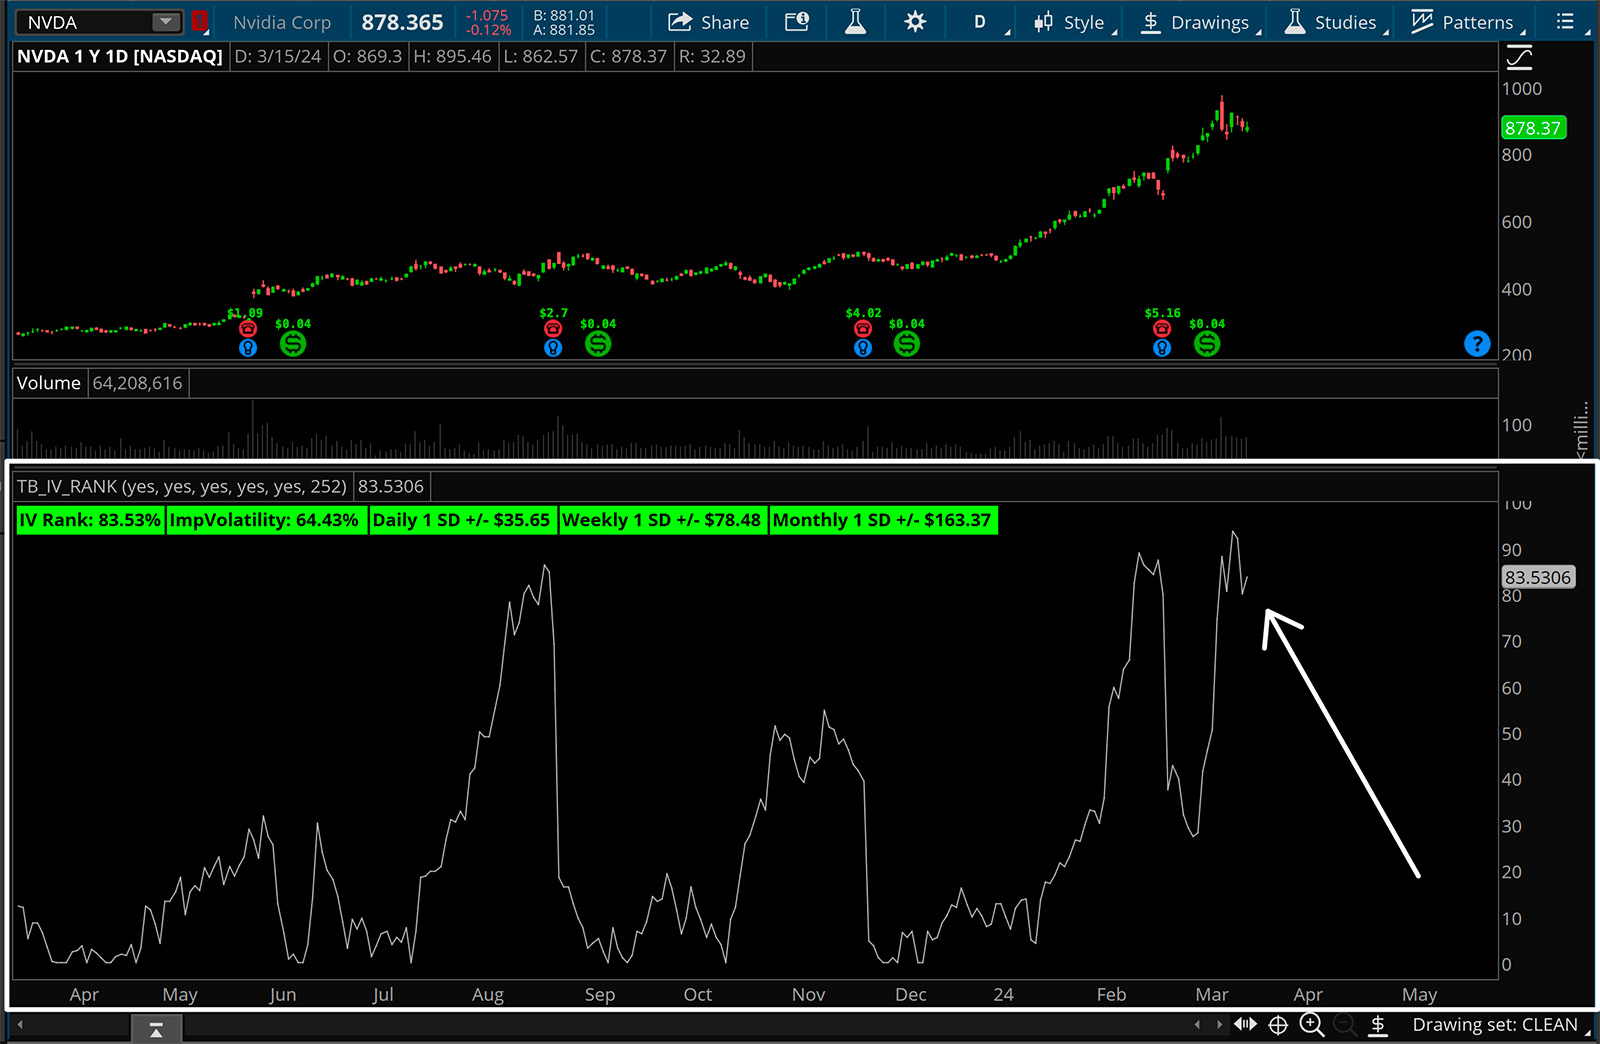
The Implied Volatility Rank study allows traders to visualize the change in implied volatility on the daily time frame as a rank out of 100%.
The Implied Volatility Rank study allows traders to visualize the change in implied volatility on the daily time frame as a rank out of 100%. Implied volatility alone only shows us the markets expectation of future volatility, but not in relationship to a normal range for the underlying stock. Implied volatility rank helps trades understand what is high or what is low by ranking implied volatility out of 100.
For example, if TSLA has an implied volatility of 115% is that high or is that low? Well if the implied volatility rank measures 50% or above, that would be high. If implied volatility ranks was below 50% that would be low. It gives us context for implied volatility.
When you are granted access to the script you can choose the one click install, or the option to view the code and copy and paste into a new study window. If you use the one click install, make sure to copy and paste the URL into the “Setup > Open shared item” dialog box in ToS. Name the script before you save it, otherwise it will import as a generic name. If you are going to copy and paste into a new study window, make sure to delete the default line of code “plot data = close”.

