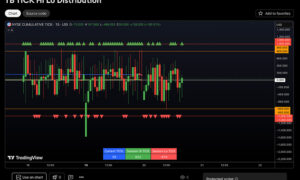
Cumulative Volume (TradingView)

$50.00
Plots the weekly cumulative volume flows for NYSE and NASDAQ exchanges.
The Cumulative Volume study was designed to provide a simple edge for retail traders, visualizing the net flows in or out of the markets. Instead of guessing and manually tracking the read day to day, you’ll get a lightning quick assessment of inflows vs outflows for the week by glancing at the Cumulative Volume study.
This script will give you the insights to determine whether or not any given move in the market is being backed by directional volume flows, or is really just divergent from what price is indicating. As a newer add on to the quad, it has certainly helped in assessing the true strength of buying or selling.
When you are granted access to this script, you will be redirected to a Tradingview page where you will have the opportunity to save the script to your favorite indicators. From there you will be able to add this script to any chart on the platform. Open a chart, open the indicators window, and navigate to the ‘Favorites’ tab on the left of this pop up and select ‘TB_CumulativeVolume.’