Breadth Ratios Historic Plot (Think or Swim)
$25.00
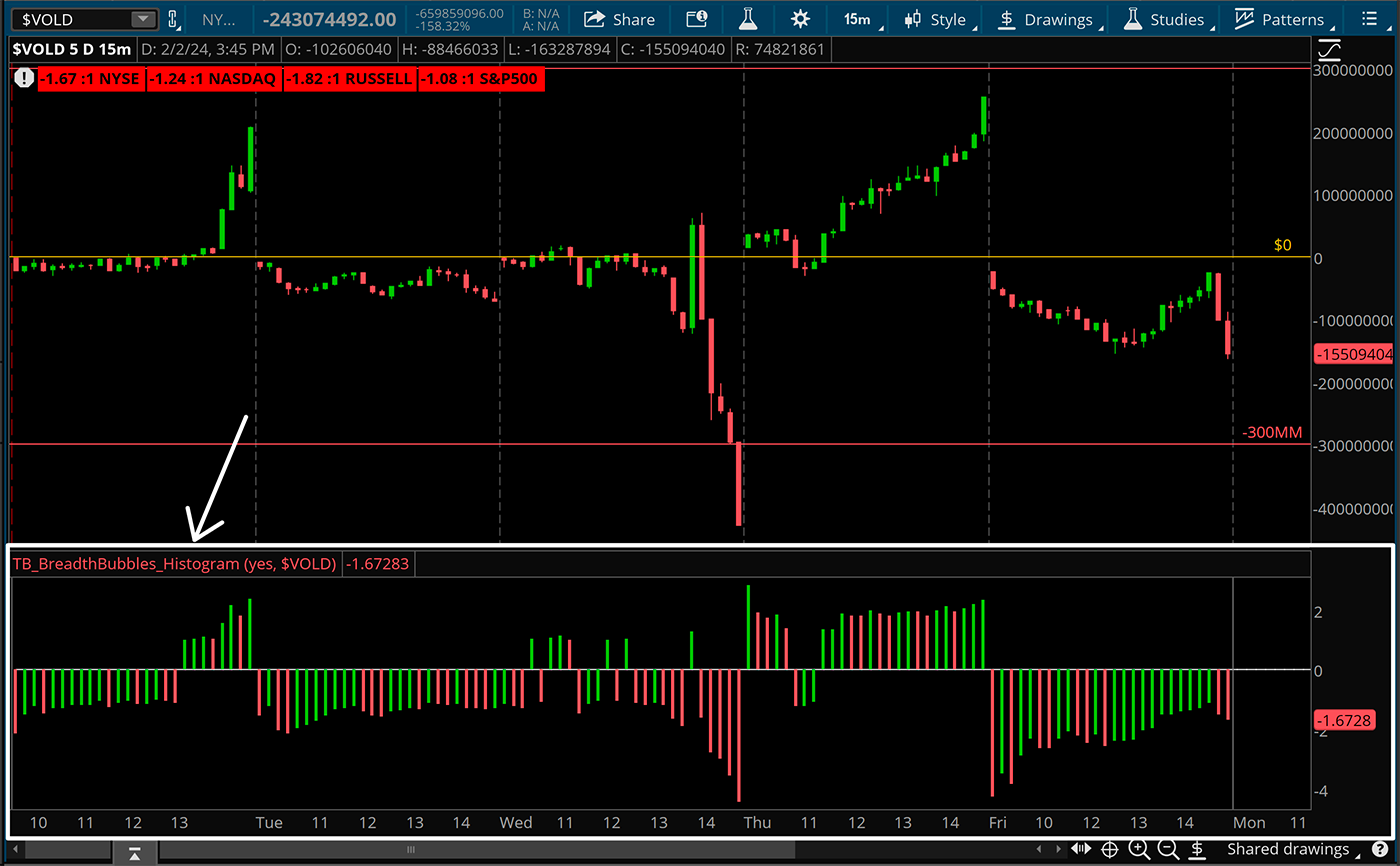
Plots the intraday breadth ratio for NYSE and NASDAQ exchanges as a histogram lower study.
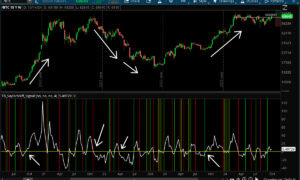
The Historic Breadth study allows traders to visualize the change in breadth as the day progresses. Instead of guessing and manually tracking the read as the day wears on, you’ll get a lightning quick assessment of inflow vs outflow strength by glancing at the Historic Breadth study.
This script will give you the insights to determine whether or not any given move in the market is being backed by sustained directional volume flows, or diminishing flows from where we began.
When you are granted access to the script you can choose the one click install, or the option to view the code and copy and paste into a new study window. If you use the one click install, make sure to copy and paste the URL into the “Setup > Open shared item” dialog box in ToS. Name the script before you save it, otherwise it will import as a generic name. If you are going to copy and paste into a new study window, make sure to delete the default line of code “plot data = close”.