Relative Strength to S&P (Think or Swim)
$0.00
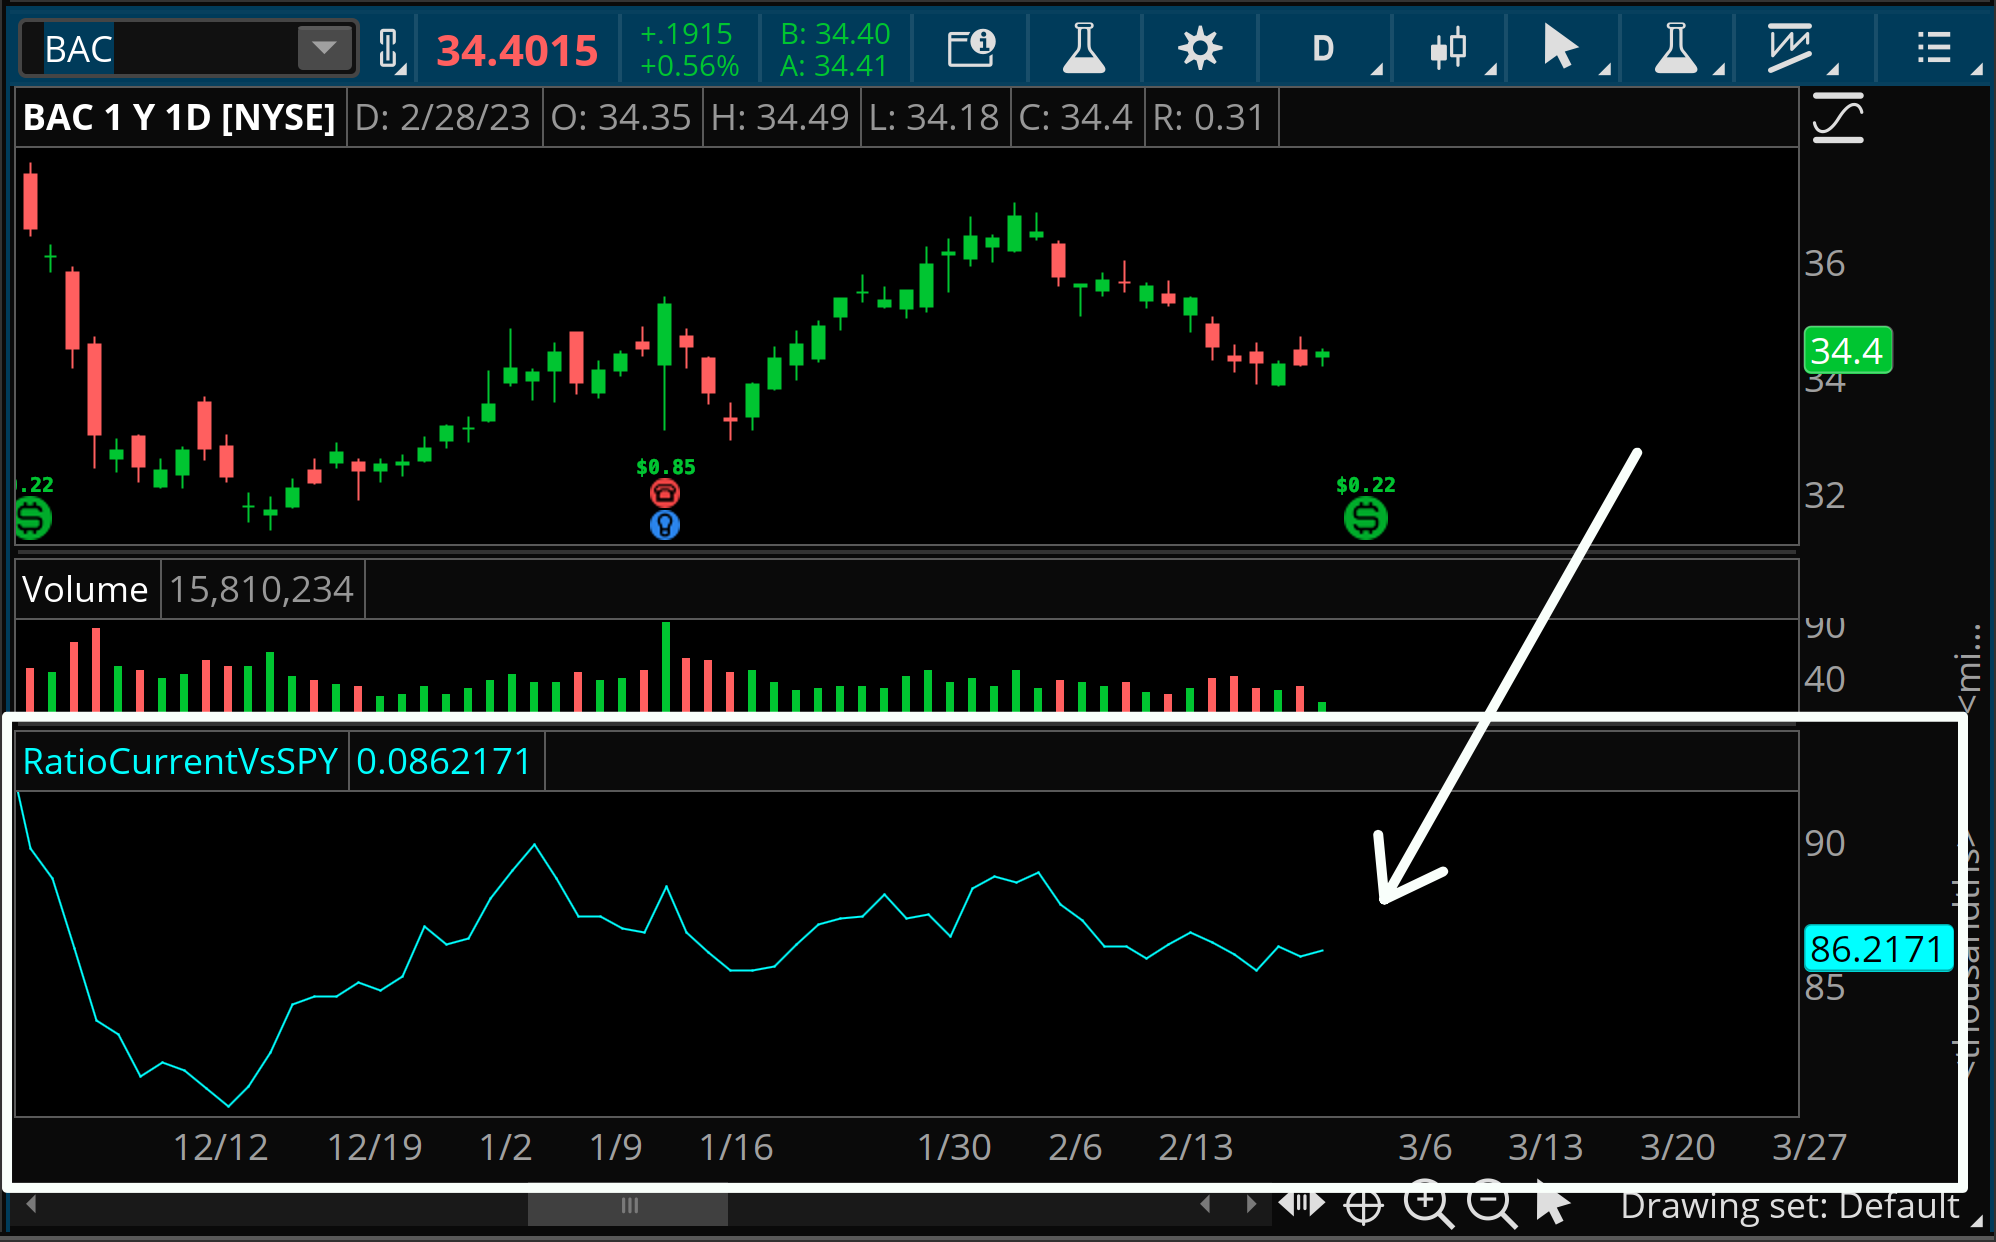
Plots the relative strength of any asset as a ratio to the SPY without having to set up a pairs study.
Quickly visualize the relative strength of the current symbol on your chart to the SPY, without the hassle of setting up a ratio pairing.
This Think or Swim indicator will display as a lower study and default to a blue solid line. The study can be customized to display as any of the plots ToS has to offer such as, line, histogram, arrows, triangles… you name it. The color can be customized as well.
The calculation that is being performed is (last price of current symbol) / (last price of SPY) and will display on whatever time frame chart you are viewing.
When you are granted access to the script you can choose the one click install, or the option to view the code and copy and paste into a new study window. If you use the one click install, make sure to name the script before you save it, otherwise it will import as a generic name. If you are going to copy and paste into a new study window, make sure to delete the default line of code “plot data = close”.