The Most Important Moving Averages In Trading
The 50 day and 200 day simple moving averages (SMA) are often regarded as the most important moving averages in trading due to their widespread adoption and ability to illustrate reliable short and long term trends.
Why 200 Days? Why 50 Days?
The period of the moving average is not random. 200 days is roughly one trading year and 50 days is a quarter of that. Using the two in conjunction traders can see a smoothed longer term trend for the rolling year and a smoothed shorter term trend for the rolling quarter. But if we want the true number of trading days in a year, why not use the 260 day moving average? Or round down with holidays and use the 250 day moving average?
Widespread Use Among Traders
Many technical indicators only work because of self-fulfilling prophecies. This is not a bad thing and does not take away from the effectiveness of an indicator. The 50 and 200 SMAs are some of the most regularly watched moving averages. The audience ranges from individual traders, to fund managers at the institutional level. If many groups of market participants are looking at the same information, and have the same assumption of what will happen, and take the same action given that information, the desired result will likely take place.
This is why we do NOT want to look at nuanced moving averages like the 260 day or 65 day moving averages. There are not enough traders watching those specific levels for the desired reaction to take place. There are hundreds of blogs, newsletters, videos, heck even trading strategies that specifically rely on the 50 and the 200 SMA. For example, the Golden Cross, and the Death Cross.
Have you ever heard the famous saying, “Nothing good happens below the 200 SMA?”
Support and Resistance Levels
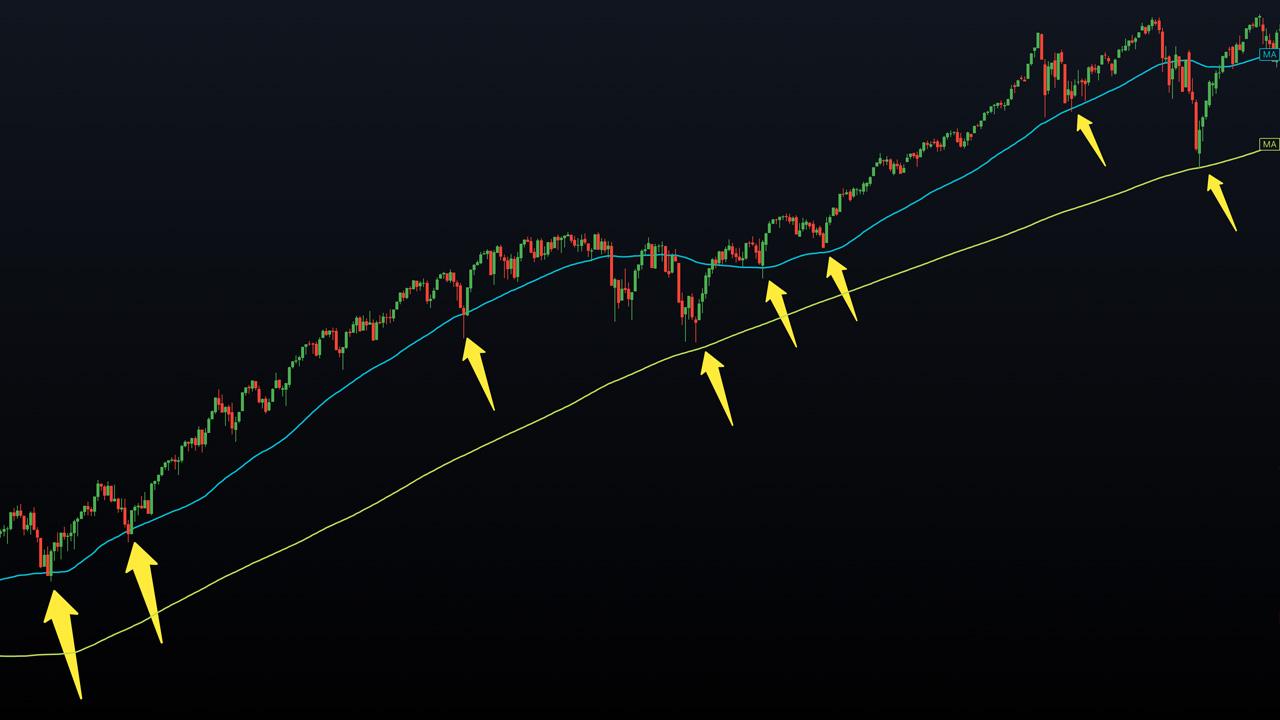
The 50 and 200 SMAs often act as dynamic support and resistance levels. When the price is above these moving averages, they can act as support, attracting buyers and providing a potential bounce area during pullbacks. When the price is below these moving averages, they can act as resistance and influence traders to have more of a bearish tone. From a risk reward perspective, it probably makes sense to have a long entry at an upward sloping 50 or 200 SMA with a stop loss just below.
A great example is looking at a historic weekly chart of the S&P500 with a 50 SMA and 200 SMA. Notice that in secular bull trends, the 200 SMA always provides support, and the 50 SMA offers a warning when breached that more downside could be coming.
Market Sentiment and Fundamental Analysis
The 50 and 200 SMAs can reflect market sentiment and investor behavior. When the price remains consistently above both moving averages, it suggests positive market sentiment and bullish investor behavior. Without even doing a full fundamental analysis of a company, you can likely assume that the fundamentals support a bull case. Conversely, if the price consistently stays below both moving averages, it indicates negative market sentiment and a fundamental case for the stock to be over valued.
It’s important to note that while the 50 and 200 SMAs are widely followed, there is no single moving average combination that guarantees success in trading. Traders often combine these moving averages with other technical indicators, chart patterns, and fundamental analysis to develop a comprehensive trading strategy that suits their individual preferences and goals.
Disadvantages of the 50 and 200 Simple Moving Averages
Moving averages of any period are considered lagging indicators. They provide information based on past price data rather than holding any predictive power. More appropriately moving averages show us what has happened and we can make assumptions about what may continue to happen. Moving averages will never guarantee any move in the market.
Sometimes even the 50 SMA is too slow for very active traders. In the case where the 50 SMA is not relevant to your analysis, the next smallest moving average most traders use is the 20 SMA. Let’s once again think about why 20? Well there are roughly 20 trading days in a month. This moving average speaks to the rolling one month trend of whatever market you are analyzing.
Conclusion
The 50 and 200 simple moving averages (SMA) have been cemented as key indicators in technical analysis. Their popularity among traders comes from the self fulfilling prophecy and widespread use by all market participants. But like everything in markets, there is no holy grail. These moving averages should help traders inform their decisions, but not be the only reason for getting into or out of a trade. There is no substitute to learning how markets move and building a backlog of screen time experience.