The Golden Cross Moving Average Strategy for Traders
In technical analysis, moving averages play a role in quickly identifying trends over multiple durations. Short term moving averages move quicker and speak to short term trends while longer moving averages speak to broader longer lasting trends. A strategy that most traders run into at some point is a moving average crossover. A short term moving average that crosses a longer term moving average.
There are many studies that evaluate what the best moving average crossover combination is but the true Golden Cross involves the 50 simple moving average and 200 simple moving average (SMA from here on).
What is the Golden Cross?
The true Golden Cross is when the 50 SMA crosses from below the 200 SMA to above the 200 SMA. This cross is seen as a bullish signal and is often considered a potential reversal indicator from a bearish or neutral trend to a stronger uptrend. If you can pair this Golden Cross with increased volume that reinforces the move, as well as any other technical structure or indications that suggest buying activity it becomes even more powerful.
The Logic Behind the Golden Cross
The Golden Cross strategy relies on the belief that the crossing of two moving averages implies a change in the short term trend of an asset. When the 50 SMA crosses above the 200 SMA, it indicates that the short-term trend is gaining strength and aligning with the long-term trend. In a golden cross we want that trend to be up.
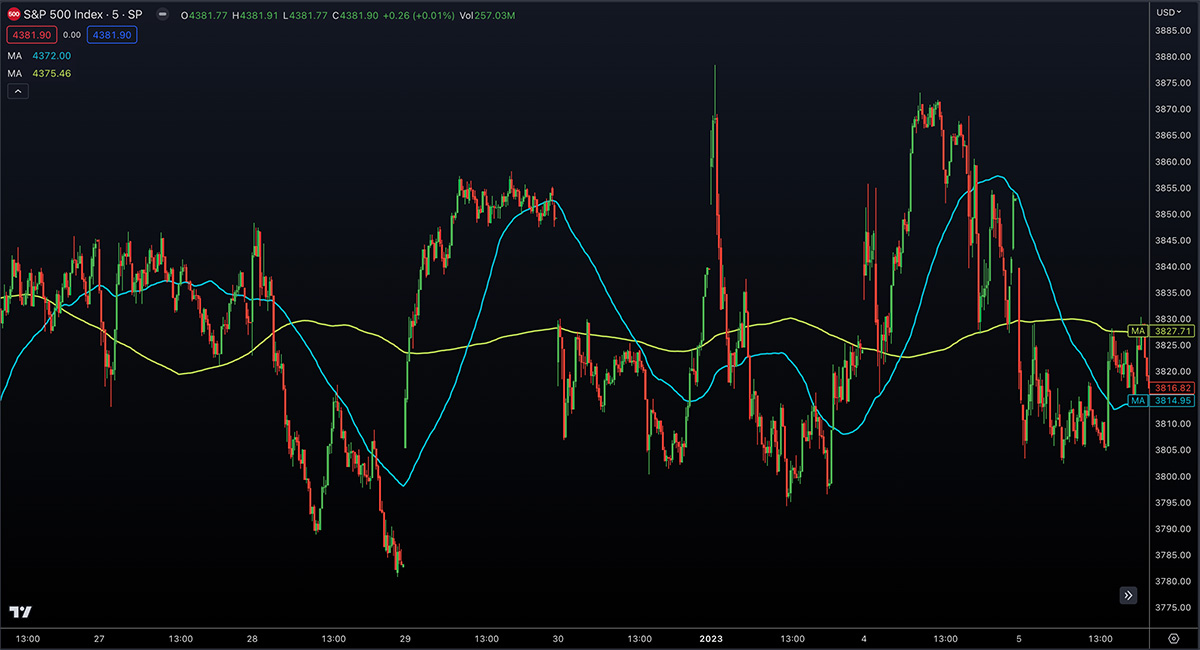
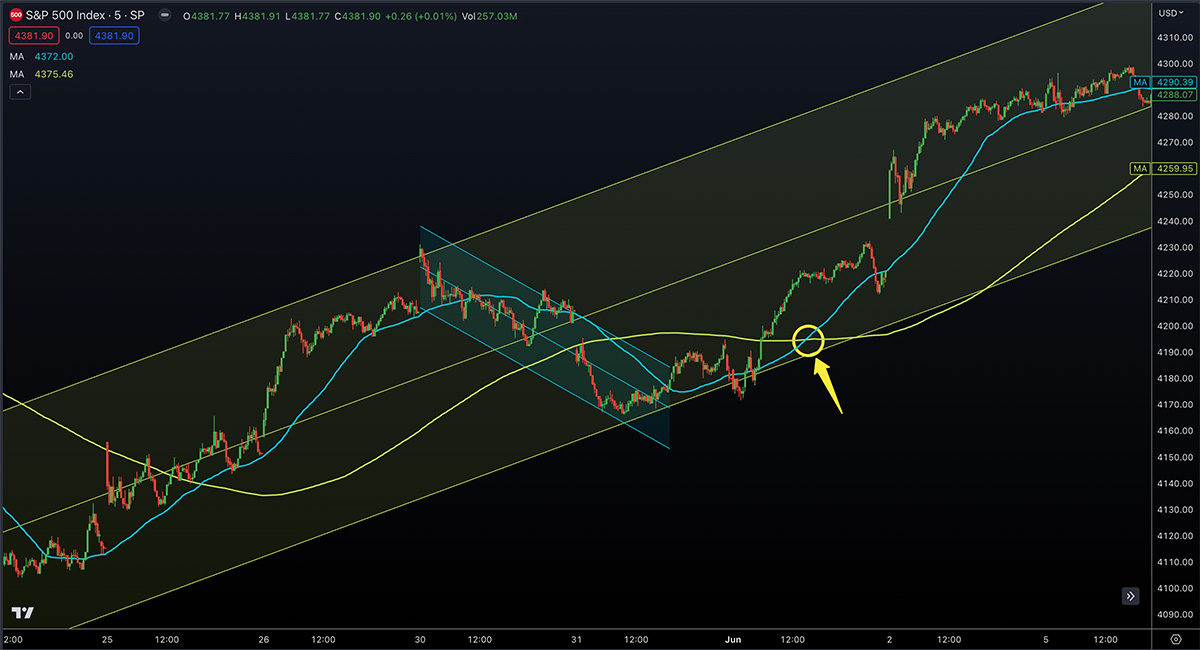 50 SMA in blue, 200 SMA in green
Think about what defines an uptrend. Sequences of higher highs and higher lows. If the 50 SMA is pointing down and below the 200 SMA there is likely a short term series of lower highs and lower lows. When and if the 50 SMA can recover and produce a true Golden Cross, that short term downtrend has likely ended. Now the 50 SMA short term trend is aligned with the longer term uptrend as noted by the 200 SMA.
Using the Golden Cross Strategy
The Golden Cross strategy can be applied in various markets, including stocks, forex, and crypto. It can be applied to any timeframe, allowing you to adapt it to your style. Swing trades, scalp trades, investments. The principle on all assets and all timeframes is the same. The short term trend is aligning with the longer term trend.
When the short term 50 simple moving average moves from below to above the 200 simple moving average, traders should look for long entry points. As noted earlier this signal becomes even more powerful if we can pair it with other technical indicators that support a bullish bias.
If the market does begin a new leg higher of the longer term uptrend you’ll likely have an entry point that is close to the start of that trend which should offer good risk to reward. When and if the moving averages make the opposite move, 50 SMA crosses from above to below the 200 SMA, it’s often referred to as a Death Cross and has the opposite implications of the Golden Cross. This can be a sell signal, but not what you should use to exit Golden Cross entries.
Two things can happen to get you out of a Golden Cross trade. You hit your target, or you stop out of the trade. If a Death Cross occurs soon after a Golden Cross it should not be the sole reason to exit the trade. If you were truly accepting of the risk when you entered, you should hold until your target or stop loss is hit.
False Signals
The Golden Cross strategy is an easy way to identify possible trend reversals and provides a clear visual signal for traders to follow. However, the strategy is far from perfect. It may generate false signals during choppy or sideways markets, and it should not be the only reason that you get into a trade. You should have a comprehensive trading strategy and this may act as a compliment.
Remember that moving averages are not forward looking and instead are lagging indicators. They take already printed price data and smooth it out over a specified period. It shows us what has happened, not what will happen.
Conclusion
The Golden Cross strategy can be a valuable tool in your technical analysis arsenal. It provides a clear and visual signal for potential trend reversals and bullish market conditions. However, it must be paired with a thorough analysis, and proper risk management systems to produce long term profitable expectancy.