Saylor-Schiff Bitcoin Signal (Think or Swim)
$50.00
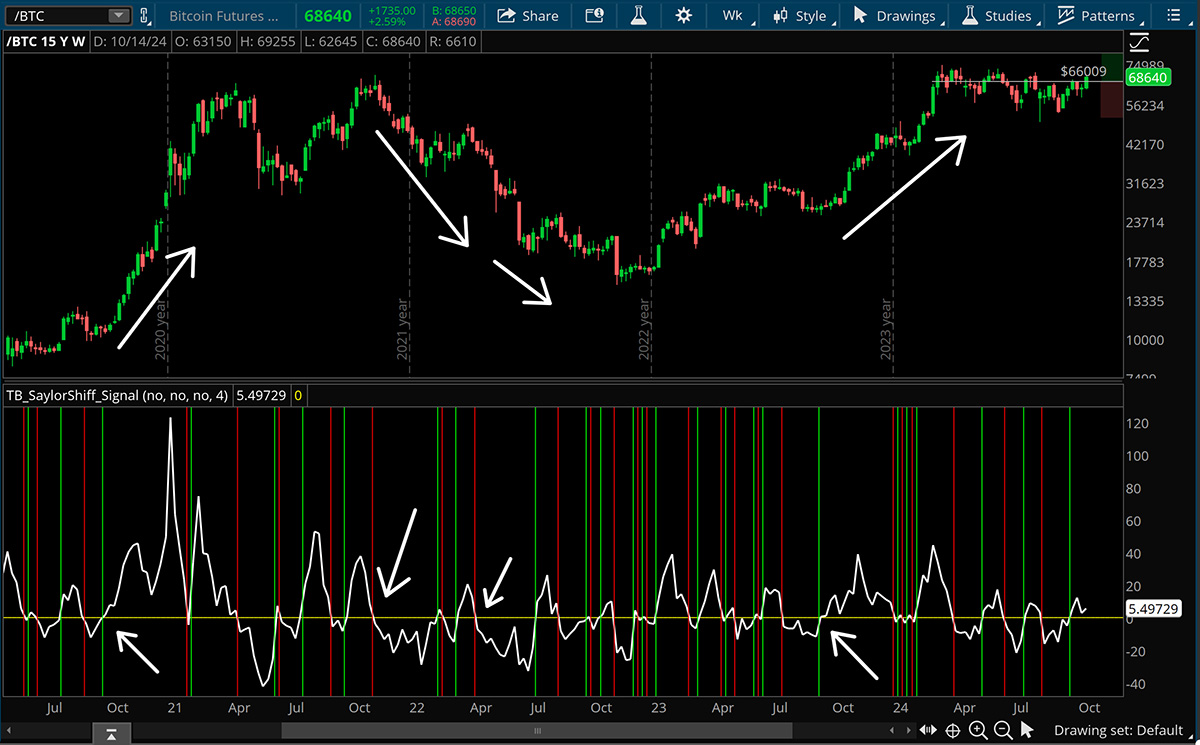
Tracks the rate of change in the ratio of BTC:GLD. Bullish “signal” when crossing from negative to positive through the zero line. Bearish “signal” when crossing from positive to negative through the zero line.
This signal by itself is NOT a recommendation to buy or sell Bitcoin. The signal is designed to understand when momentum is possibly changing and help add context to Bitcoin analysis. Crypto currency is a risky asset class and any investment into this market should be carefully considered with a registered financial advisor.
The Saylor Schiff tool takes the most bullish Bitcoin Bull (Michael Saylor) and the most bullish Gold Bull (Peter Schiff) and plots them against each other. From there the script calculates the rate of change in the ratio to provide an insight as to when momentum shifts from Gold being the out-performer to Bitcoin taking the lead.
Knowing when momentum is shifting can help assess when Bitcoin is moving into a more risk-on period, or a more risk-off period.
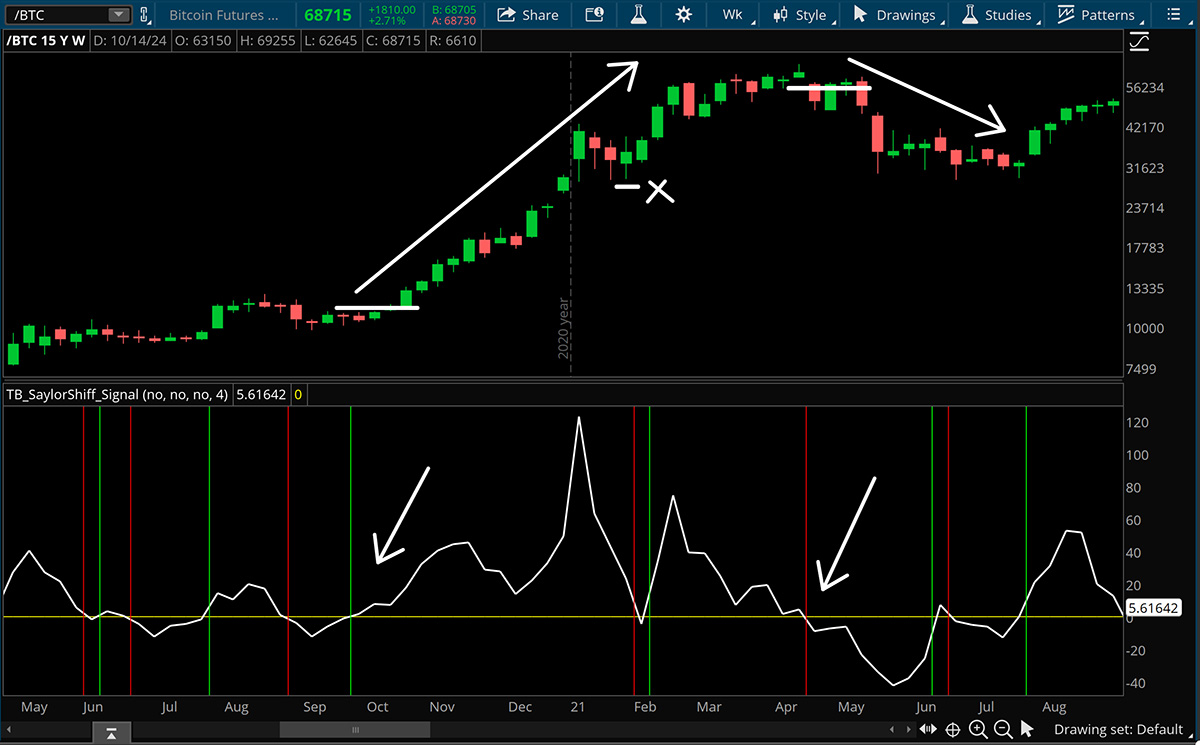
Generally the indicator works best when evaluating Bitcoin on a weekly timeframe chart, with the rate of change in the indicator set to 4. This gives us about a 1 month rate of change which help filters out some of the smaller timeframe noise that crypto is notorious for.
When the indicator passes from negative to positive, a bullish signal is fired. The indicator will print a green vertical line on the study. The idea would be that Bitcoin can continue to display strength and is more likely to move higher if it can break the prior week’s high that caused the bullish signal. If the signal bar’s high is never taken out the signal is still valid until the prior bar’s low is taken out or the indicator moves back below the 0 line.
When the indicator passes from positive to negative, a bearish signal is fired. The indicator will print a red vertical line on the study. This should indicate a shift in momentum, with the possibility for a reversal if we take out the weekly signal bar’s low. If the low is never taken out, the bearish signal is invalidated when we take out the weekly signal bar’s high, or the indicator produces a bullish signal.

