Breadth Ratios & Historic Plot (TradingView)
$25.00
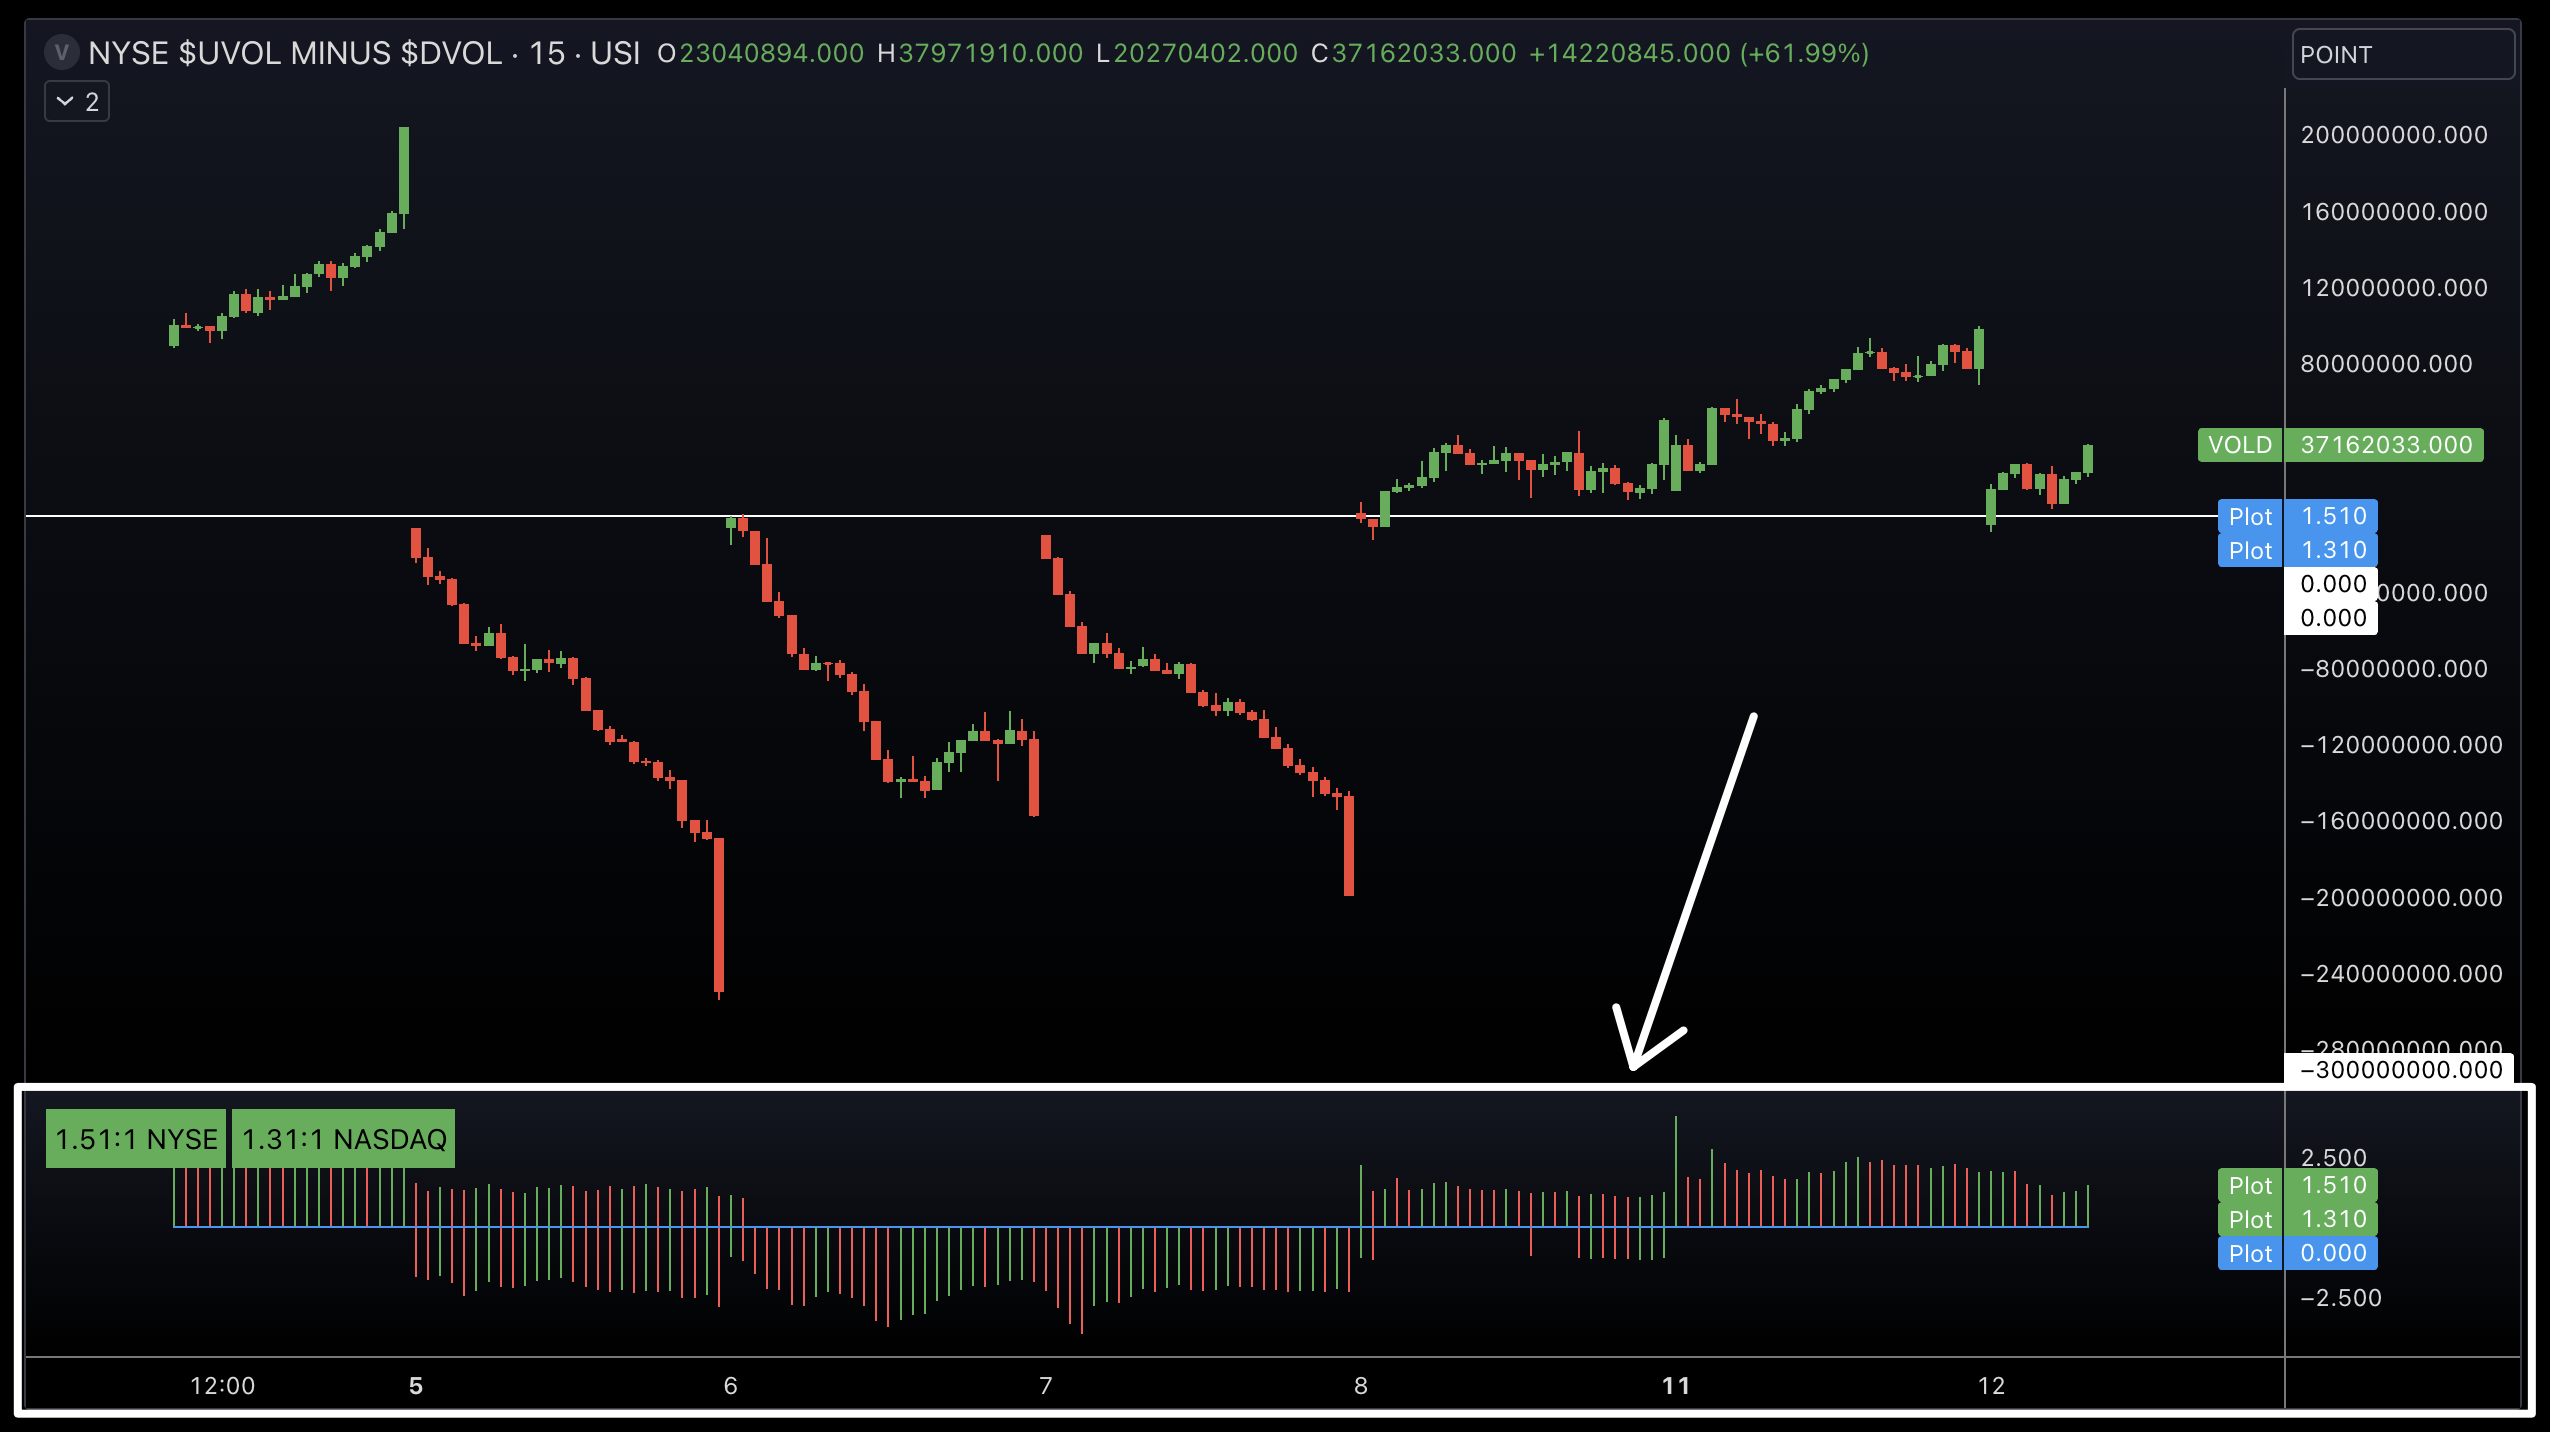
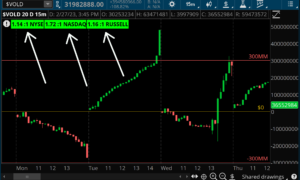
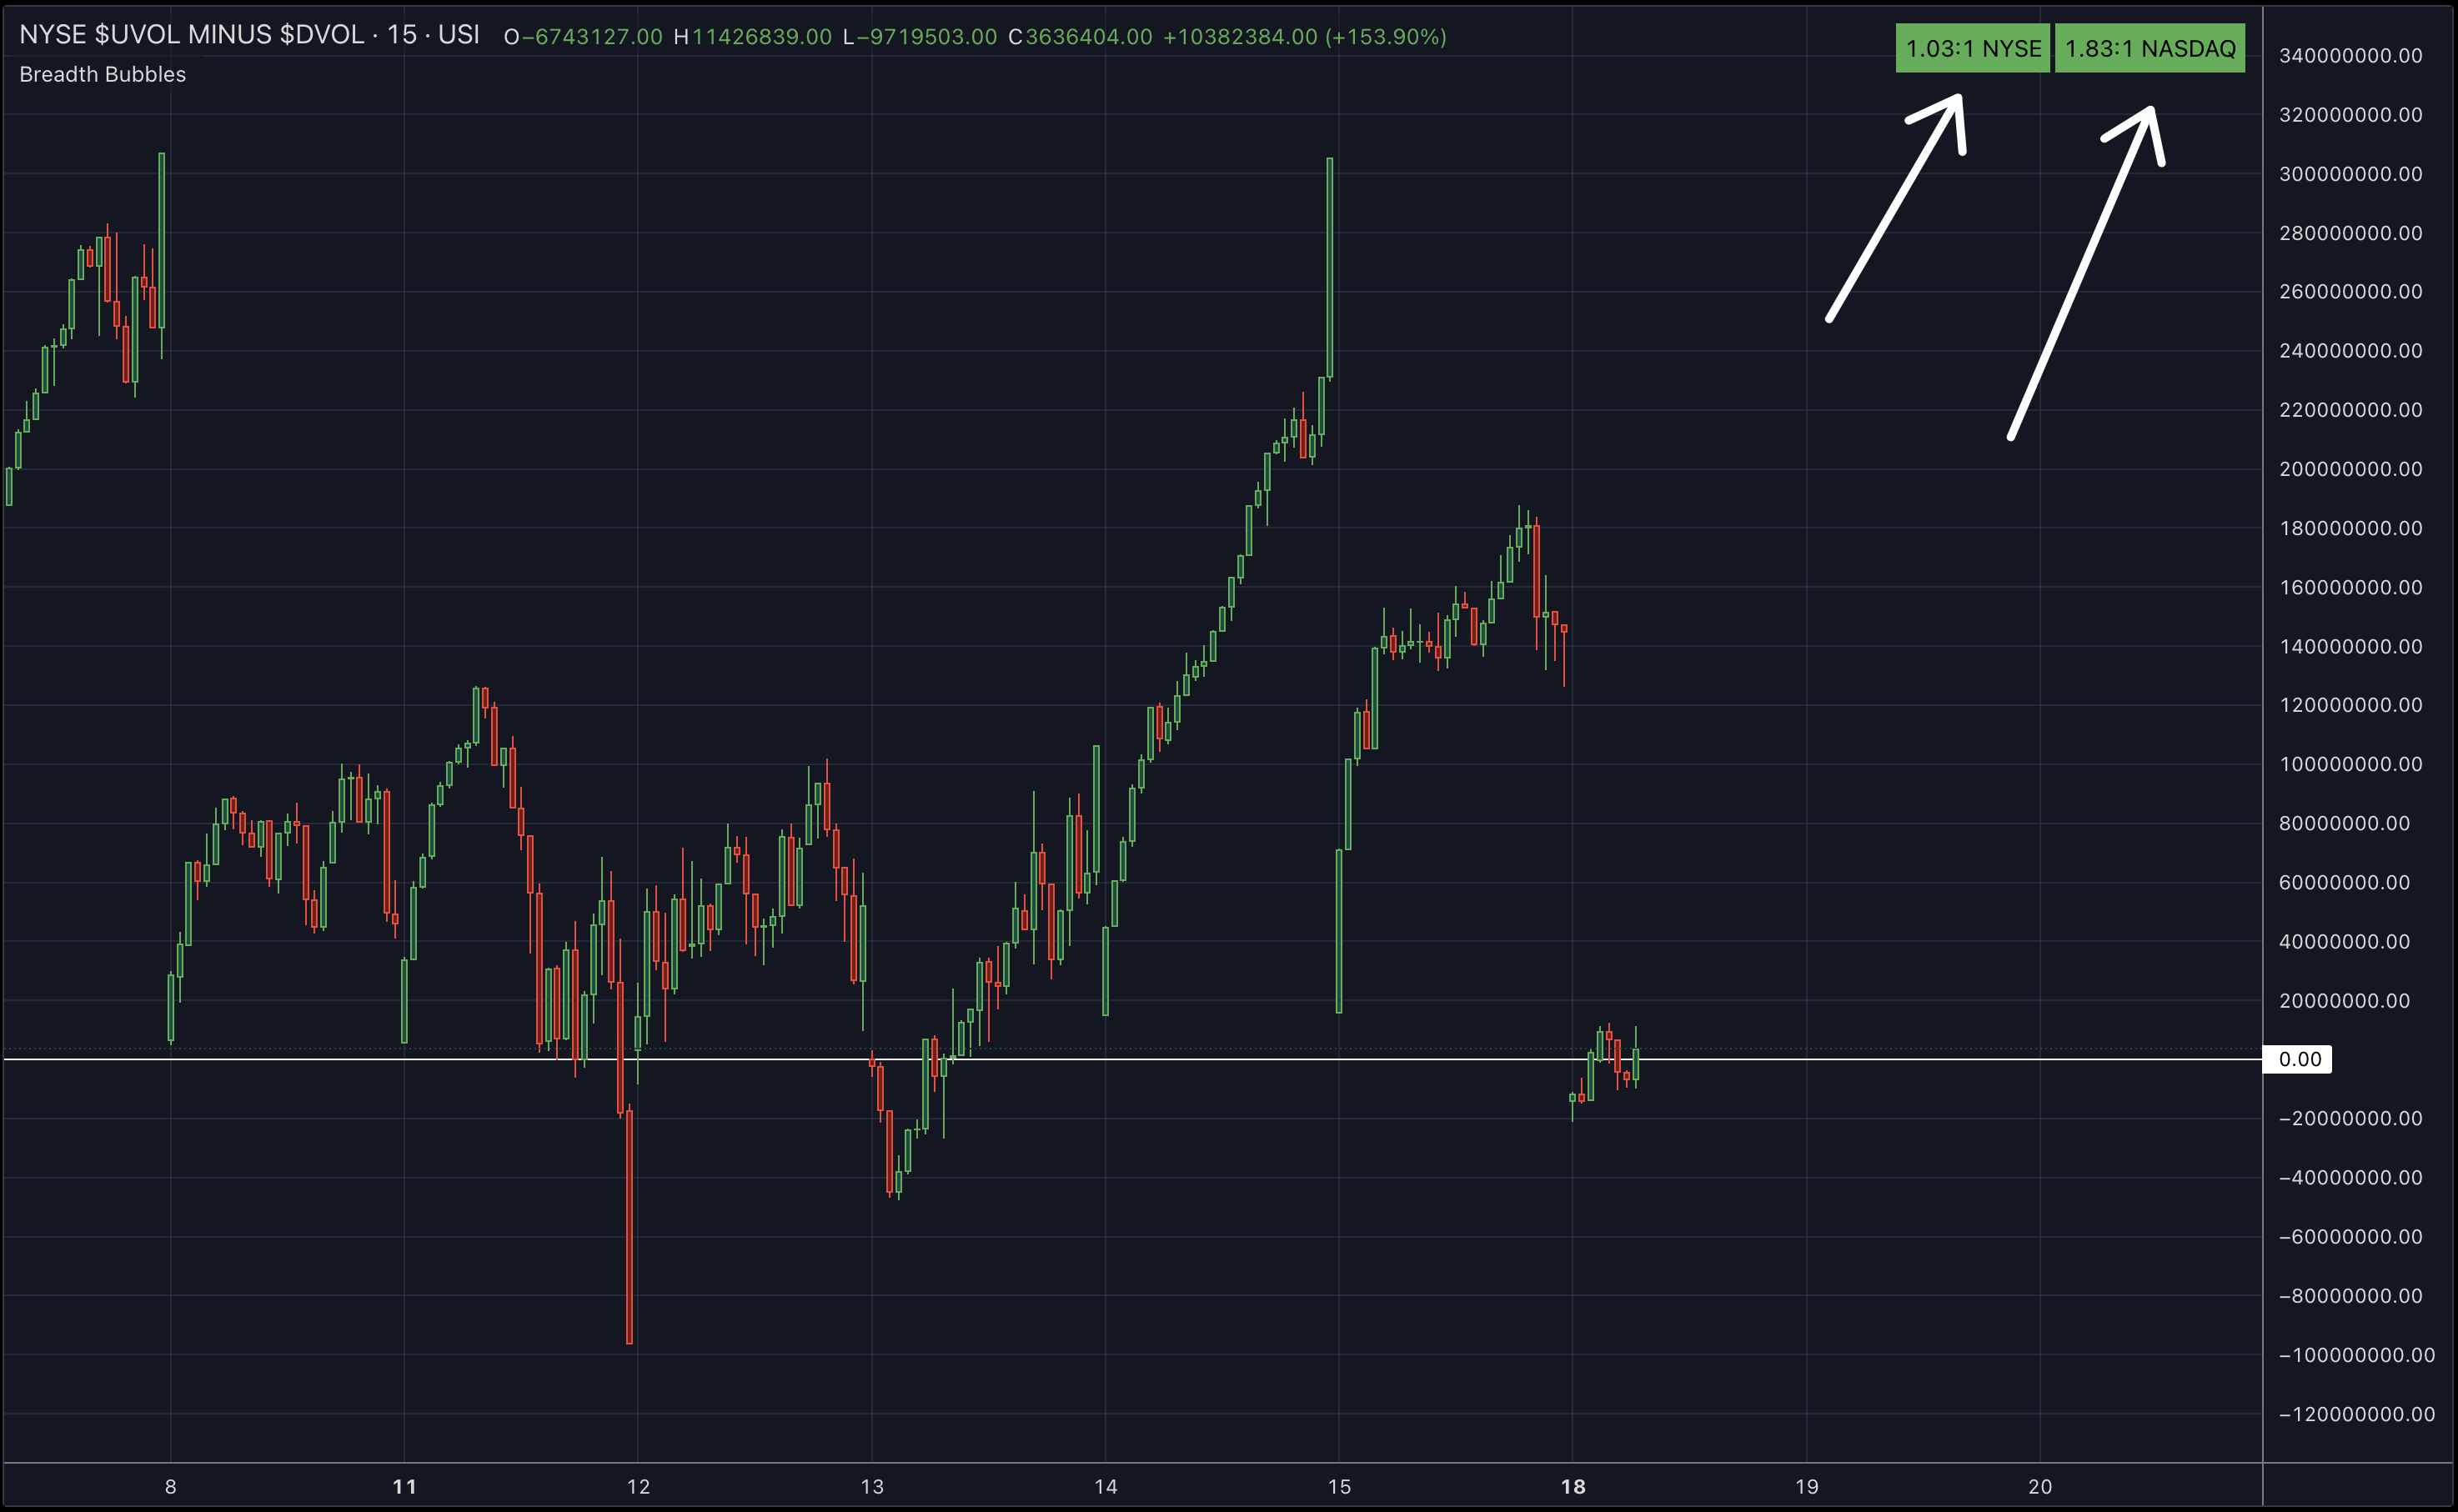
Ratio of up volume to down volume on the two big exchanges. NYSE & NASDAQ. Option to download a version that shows the historic ratio as a histogram in a lower pane as well.
The script shows us the aggression from the buyers vs sellers from a volume perspective and whether or not the market has momentum. Of course knowing when there is NOT momentum is also massively valuable so trading strategies can be applied accordingly, based on the environment.
Script displays as bubbles in the top right of your chart and full color customization is available.
When you are granted access to this script, you will be redirected to a Tradingview page where you will have the opportunity to save the script to your favorite indicators. From there you will be able to add this script to any chart on the platform. Open a chart, open the indicators window, and navigate to the ‘Favorites’ tab on the left of this pop up and select ‘TB_BreadthBubbles.’
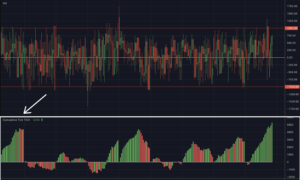
Historic version show the ratio over time in a lower histogram like the image below: