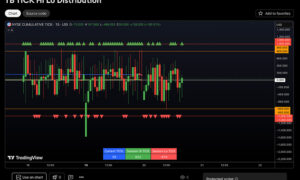
Cumulative Volume (Think or Swim)
$50.00
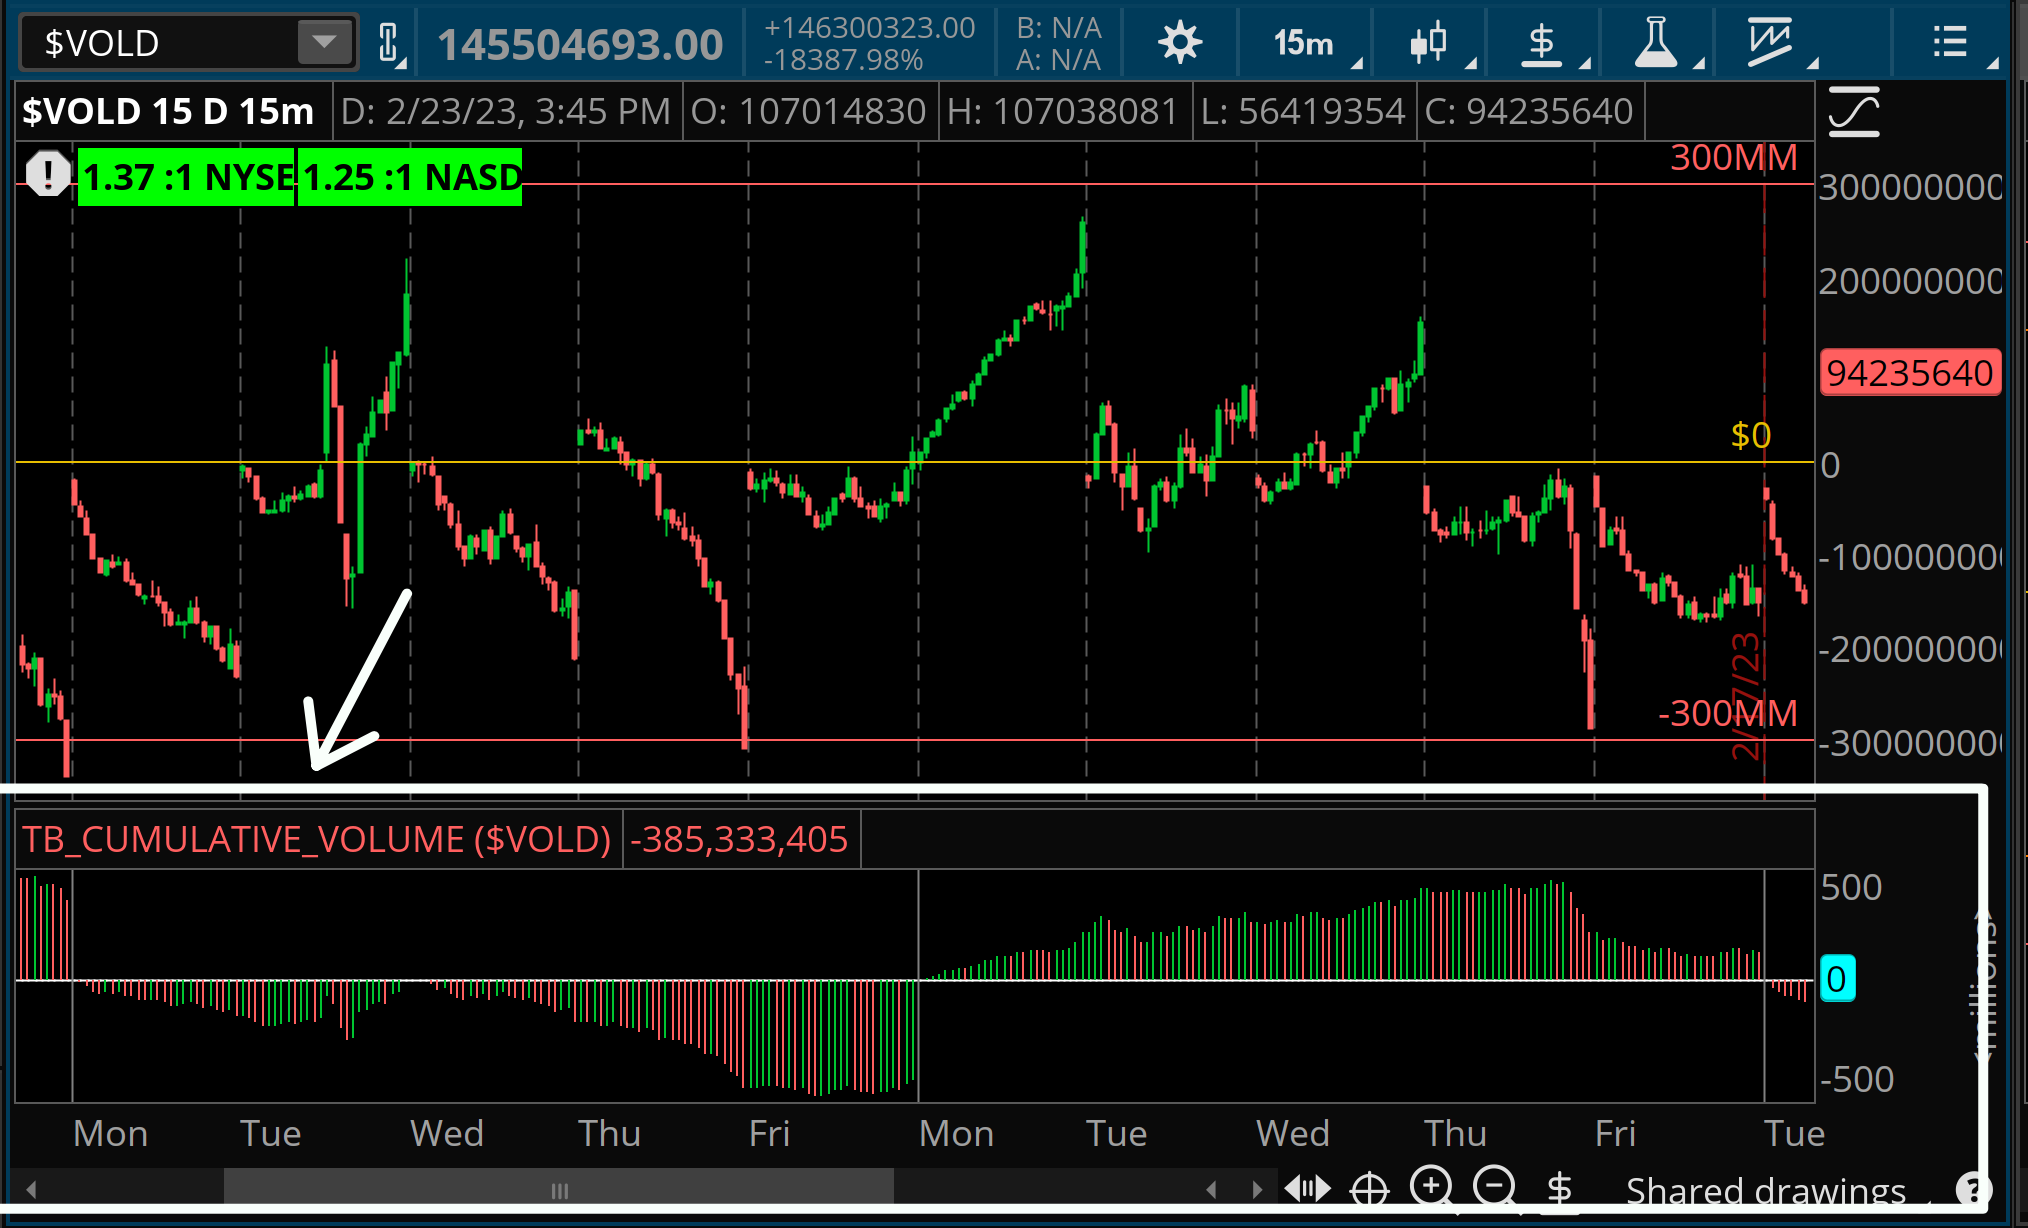
Plots the weekly cumulative volume flows for NYSE and NASDAQ exchanges.
The Cumulative Volume study was designed to provide a simple edge for retail traders, visualizing the net flows in or out of the markets. Instead of guessing and manually tracking the read day to day, you’ll get a lightning quick assessment of inflows vs outflows for the week by glancing at the Cumulative Volume study.
This script will give you the insights to determine whether or not any given move in the market is being backed by directional volume flows, or is really just divergent from what price is indicating. As a newer add on to the quad, it has certainly helped in assessing the true strength of buying or selling.
When you are granted access to the script you can choose the one click install, or the option to view the code and copy and paste into a new study window. If you use the one click install, make sure to name the script before you save it, otherwise it will import as a generic name. If you are going to copy and paste into a new study window, make sure to delete the default line of code “plot data = close”.

