Market Profile: Point of Control and Value Area
A great way to visualize price action through the lens of an auction is the market profile. The profile tracks where prices are over time but when compressed, shows us at what price, the market spent the most time.
Within the market profile, there are time based structures that can emerge, and also volume based structures that emerge. The two most common volume and time based indications to explore are the point of control and the value area. These can be helpful signposts for traders, hinting at where prices might be headed, and what types of participants are getting active in the market.
So, what exactly is the point of control and value area?
Point of Control (POC)
The point of control is the easier of the two indications to understand. Very simply, the point of control represents where the most volume transacted, or where the most time was spent on the day’s session. It can be considered the fairest price to “do business” and where the market is most efficient.
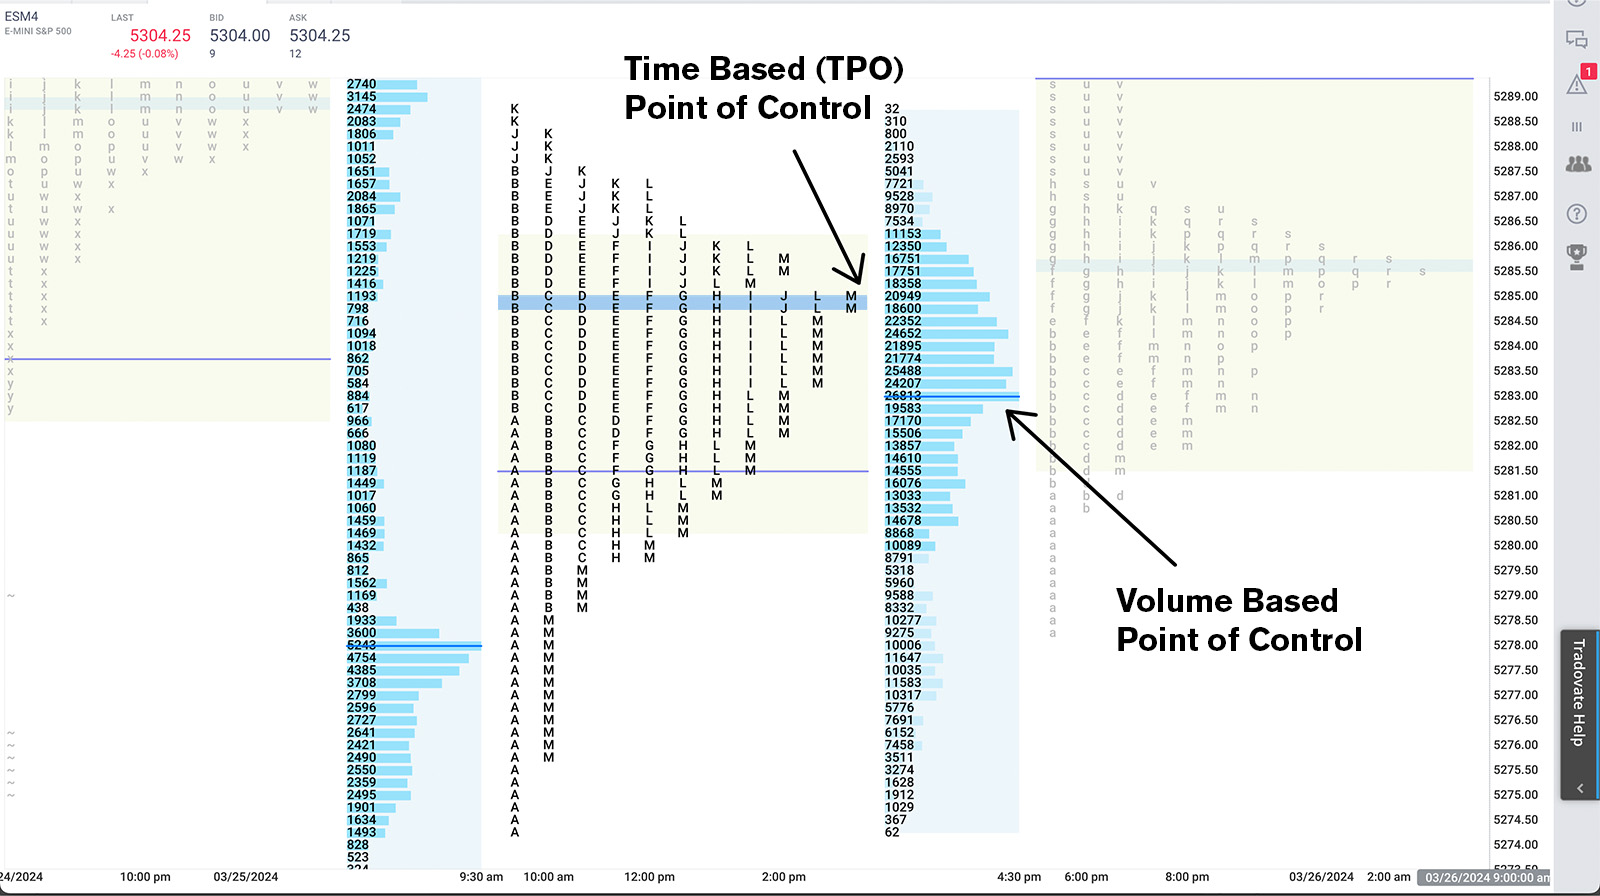
For this reason, the point of control can be thought of as a place to finish a trade, not begin a trade. If the market is always trying to be efficient in distributing contracts, the point of control represents a place where price should be drawn to, not necessarily pushed away from. Mean reversion trades usually end at the point of control. If you enter near a point of control, unless there is a catalyst, the market does not have an incentive to begin price discovery and push away from that point of control.
If you notice that the market is bouncing off of a previous point of control fairly accurately, this could be an indication of a weak or mechanical level which is different from a poor level.
Value Area
The value area represents 70% of the total volume or time based price range (TPOs) that transacted on the day. We use 70% because it represents about one standard deviation. The 70% distribution is based on the total number of contracts or TPOs from the point of control, not just equidistant from the point of control.
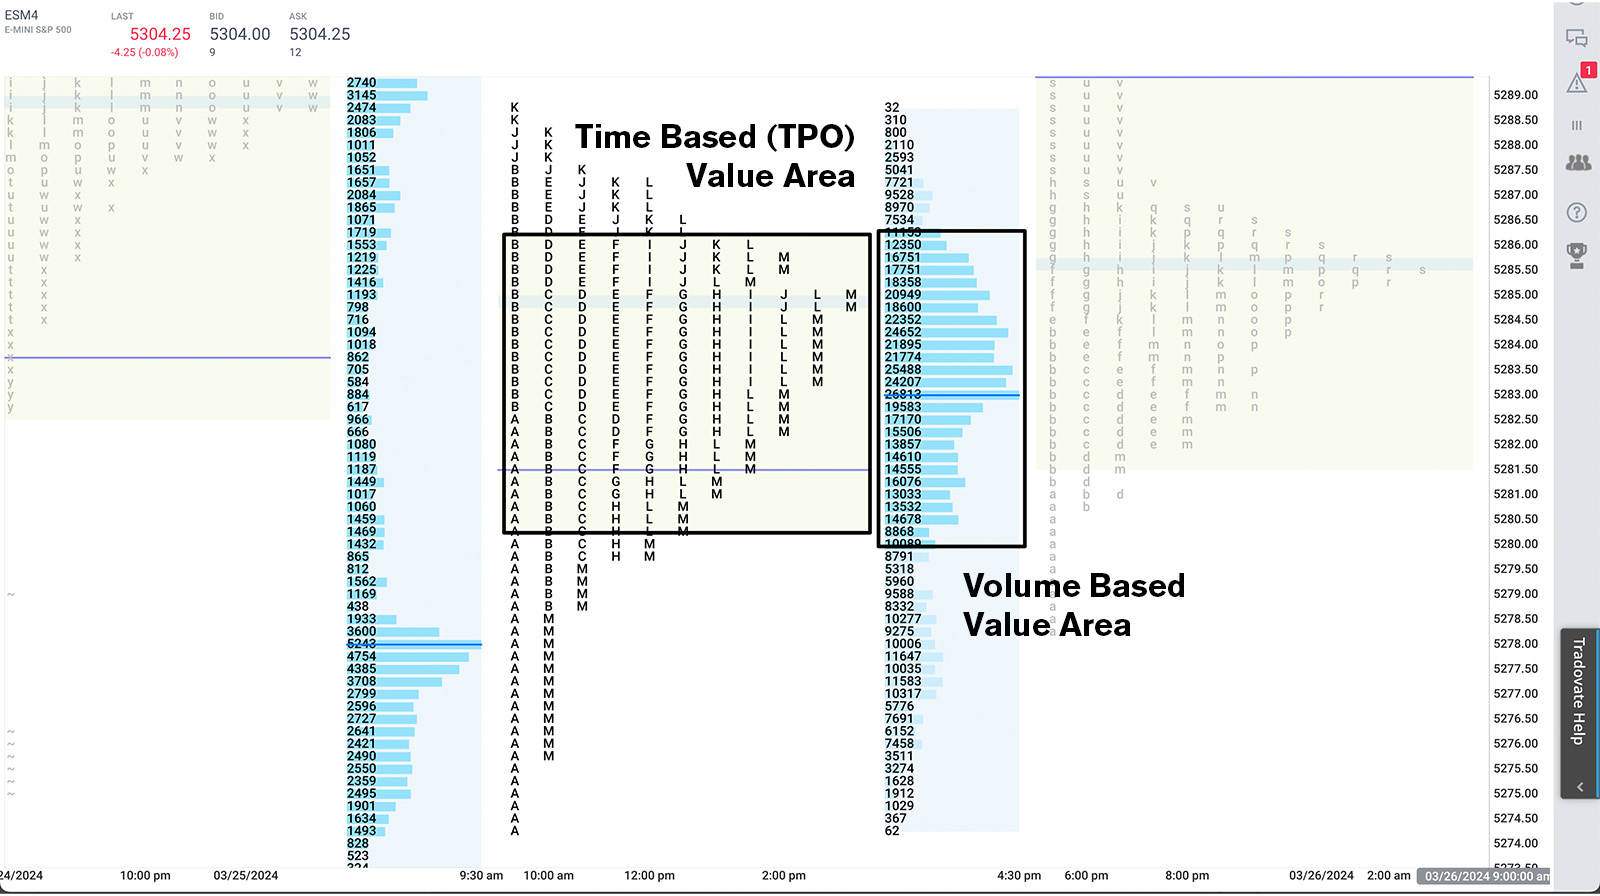
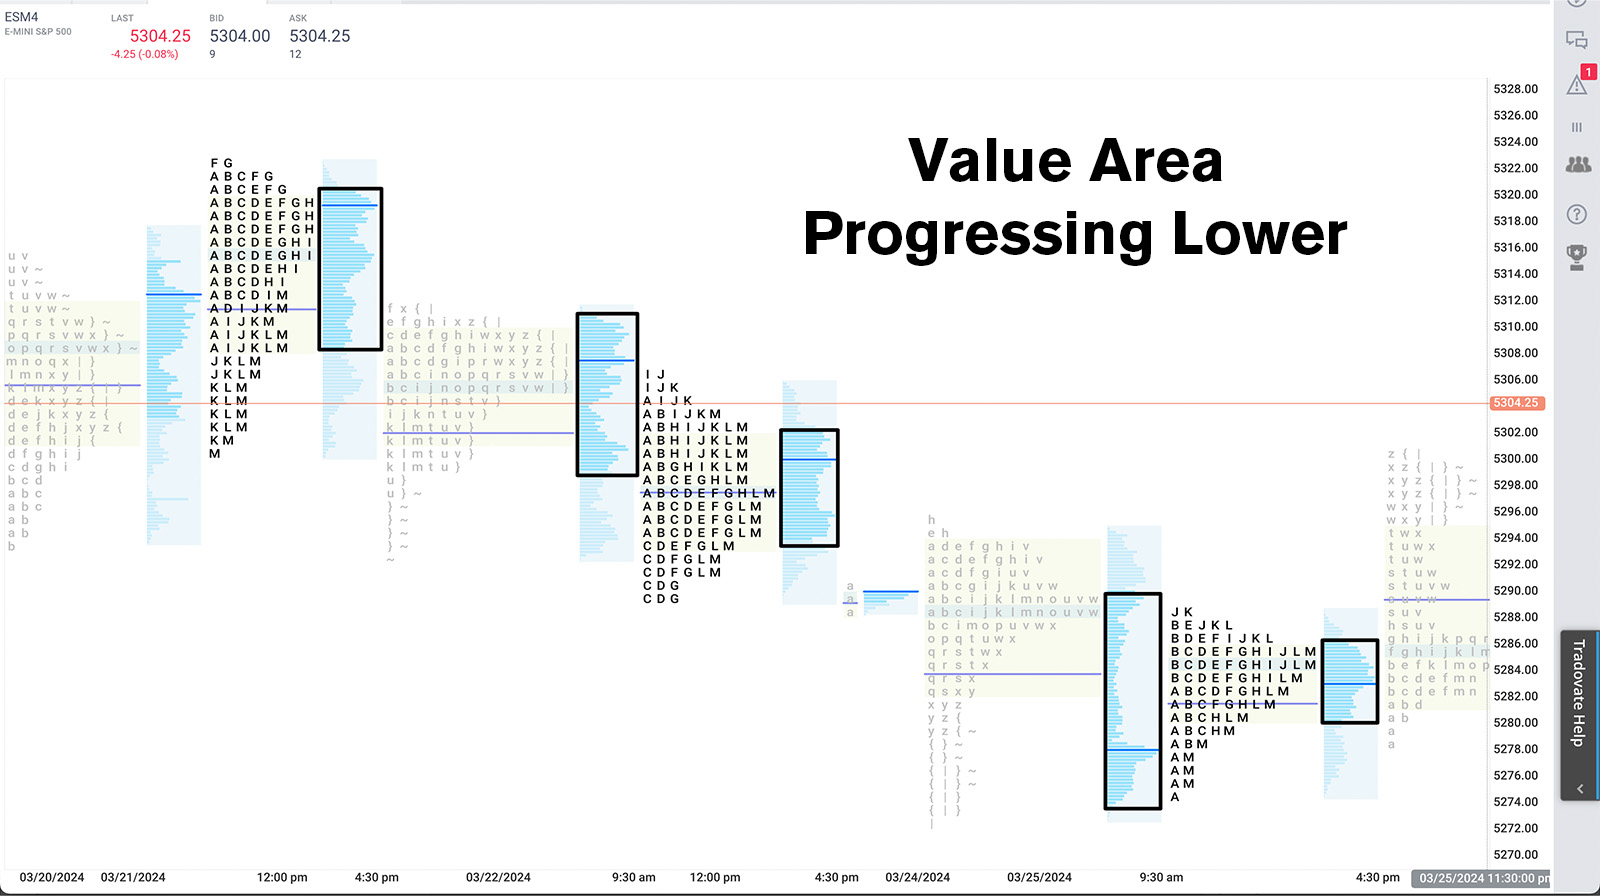
Value represents where a majority of transactions took place. We can also think of a value area representing acceptance. If value is continuously moving in the upward direction, buyers are making progress in auctioning prices higher with confirmation. If value drifts lower, we would say that sellers are making progress.
In the case of gap opens this is incredibly insightful. If value moves higher even if the day is dominated by an intraday downtrend in the example of a gap up, technically buyers made progress on that day. If we opened on a large gap down out of the prior day range, trended higher during the intraday session yet value was still left below the previous session’s value, sellers made progress. Even if the intraday trend was up.
When markets open the day contained inside of the previous day’s value area, the assumption is that the market should remain balanced, and two sided trade can resume. We would then perceive that initiative buying or selling is taking place when and if we break the value area high or the value area low. To confirm that initiative buying or selling, we want to see value progress and close the day in the direction of the break.
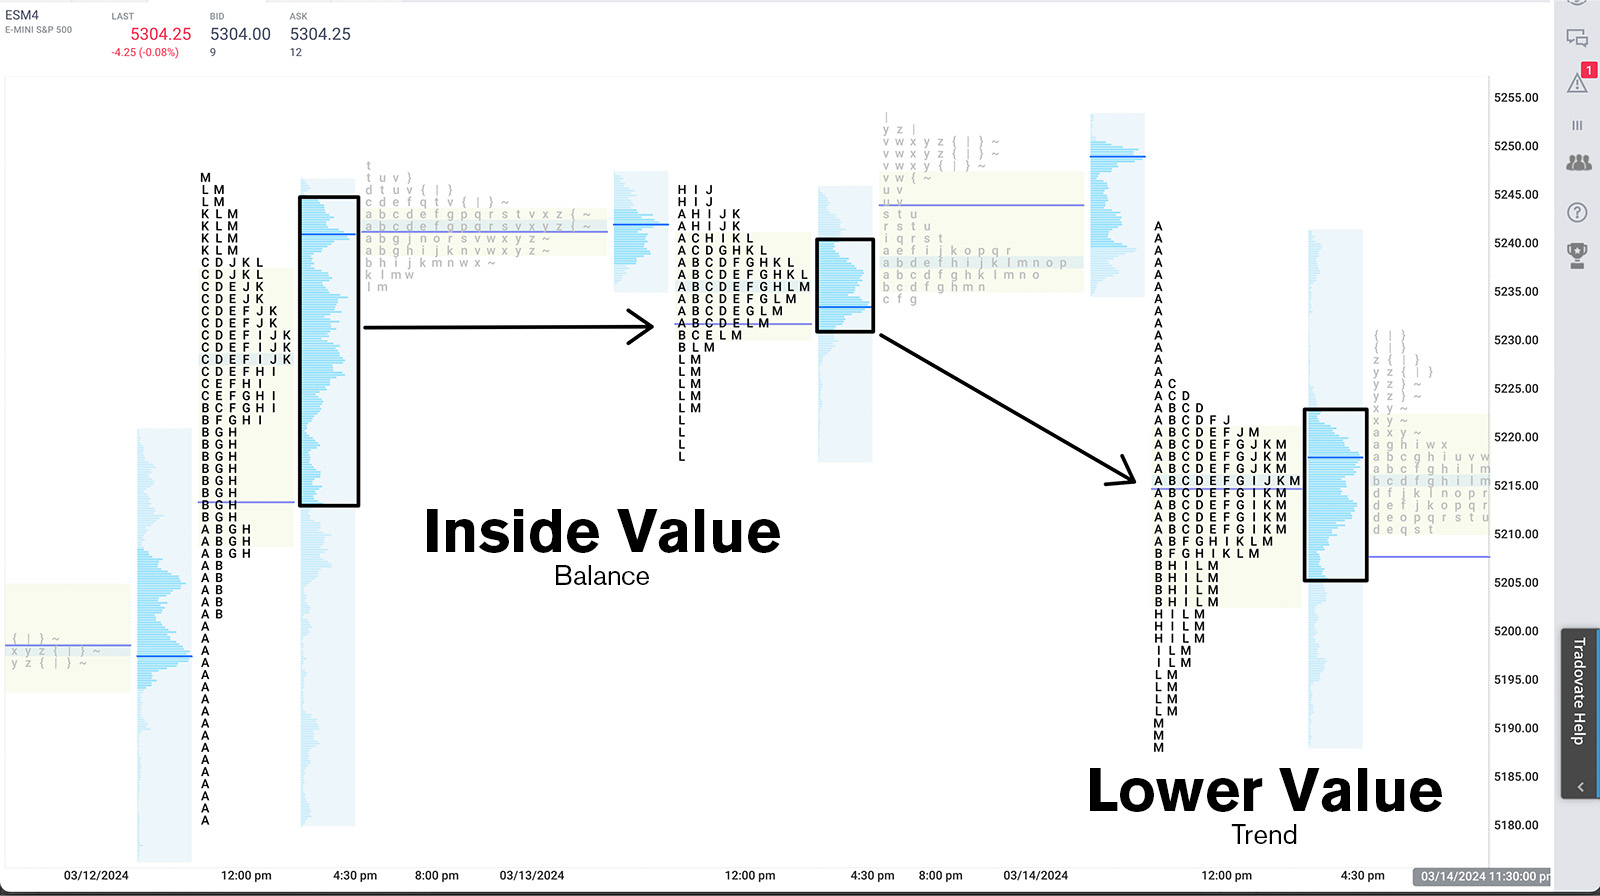
In the case of a balanced market that is not trending, we look for value areas to be compressed and wide. When markets are more clearly trending, expect a value area that is expansive and thin.
For more nuances on the market profile, read more from the godfather himself Jim Dalton. This book is dense, but a great thorough investigation of decades studying the auctioning of markets.