Market Profile: Understanding Poor Highs and Lows
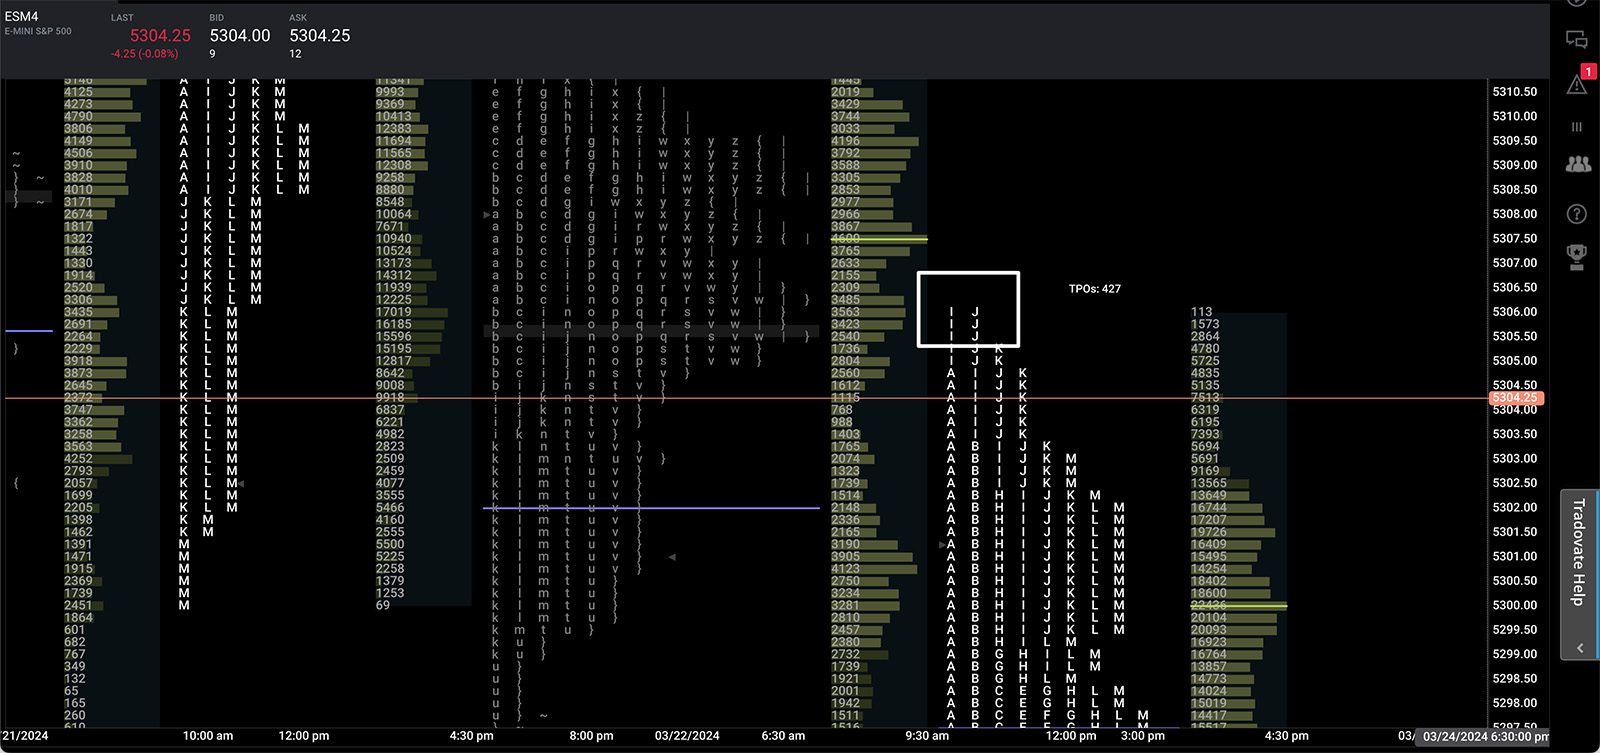
A great way to visualize price action through the lens of an auction is the market profile. The profile tracks where prices are over time but when compressed, shows us at what price, the market spent the most time at.
Within the market profile, there are specific patterns called poor highs and lows. These can be helpful signposts for traders, hinting at where prices might be headed, and what types of participants are getting active in the market.
So, what exactly are poor highs and lows?
Poor High
Imagine the market reaching a new high for the day. The high is set, and then perhaps the market pulls back. Then the market attempts to move back to that high, touches it, but instead of breaking out, it quickly dips back down. If this happens over the span of two TPO periods (30 minute intervals) we have a poor high.
The first suggestion of the poor high is that the market should back away from the level, meaning to the downside. The reasoning behind this is that buyers are trapped with poor location on the second test. Instead of getting the breakout, it looks more like a micro double top. When and if those longs decide to close out of their positions, they add selling pressure to the market. If you are quick enough and can combine looking for a poor high with order flow basics you might be able to take the short there.
The second suggestion is that the auction ended improperly at the high and when and if retested at some point in the future, we look for a breakout to the upside. The theory behind this one is that there was no excess. There was no emotional bang, and therefore those prices were deemed “fair.” Auction theory would tell us that if we are going to see a true high after price exploration, it should be emotional.
Think of a car auction, if there is consensus at 100k and all bidders stop at that level, that’s fair value. The seller likely wants to sell for above fair value. The proper end of the auction happens when two impassioned buyers battle back and forth, paying whatever price they can to purchase the vehicle. Everyone else thinks they’re crazy, but that’s how price discovery works. What is the maximum price someone is willing to pay for the asset?
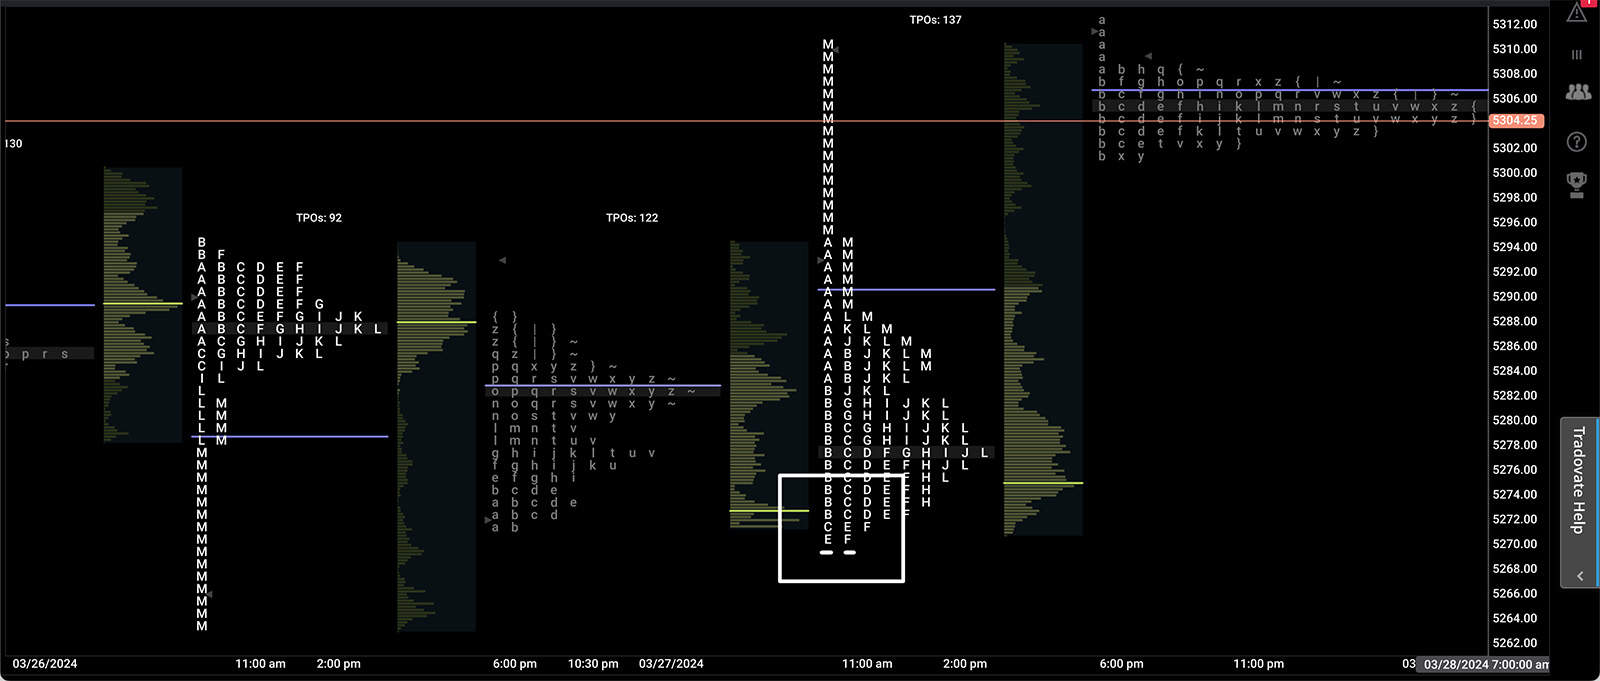
Poor Low
A poor low is the exact inverse of a poor high. A poor low happens when price makes a low of day, sets a lower high, and then revisits the low of day without breaking through. Price rebounds up quickly showing us that the sell side auction ended improperly, and a move higher should be the first impulse. Second impulse is that the structure is deficient, and any retests of the level should cause it to break.
Nuance of Market Profile
Depending on the price of the instrument, we can also have highs and lows that “lack material excess.” This is when the low was perhaps taken out by one tick or a few ticks in an example like the /NQ without really being that emotional end of the auction we were referring to.
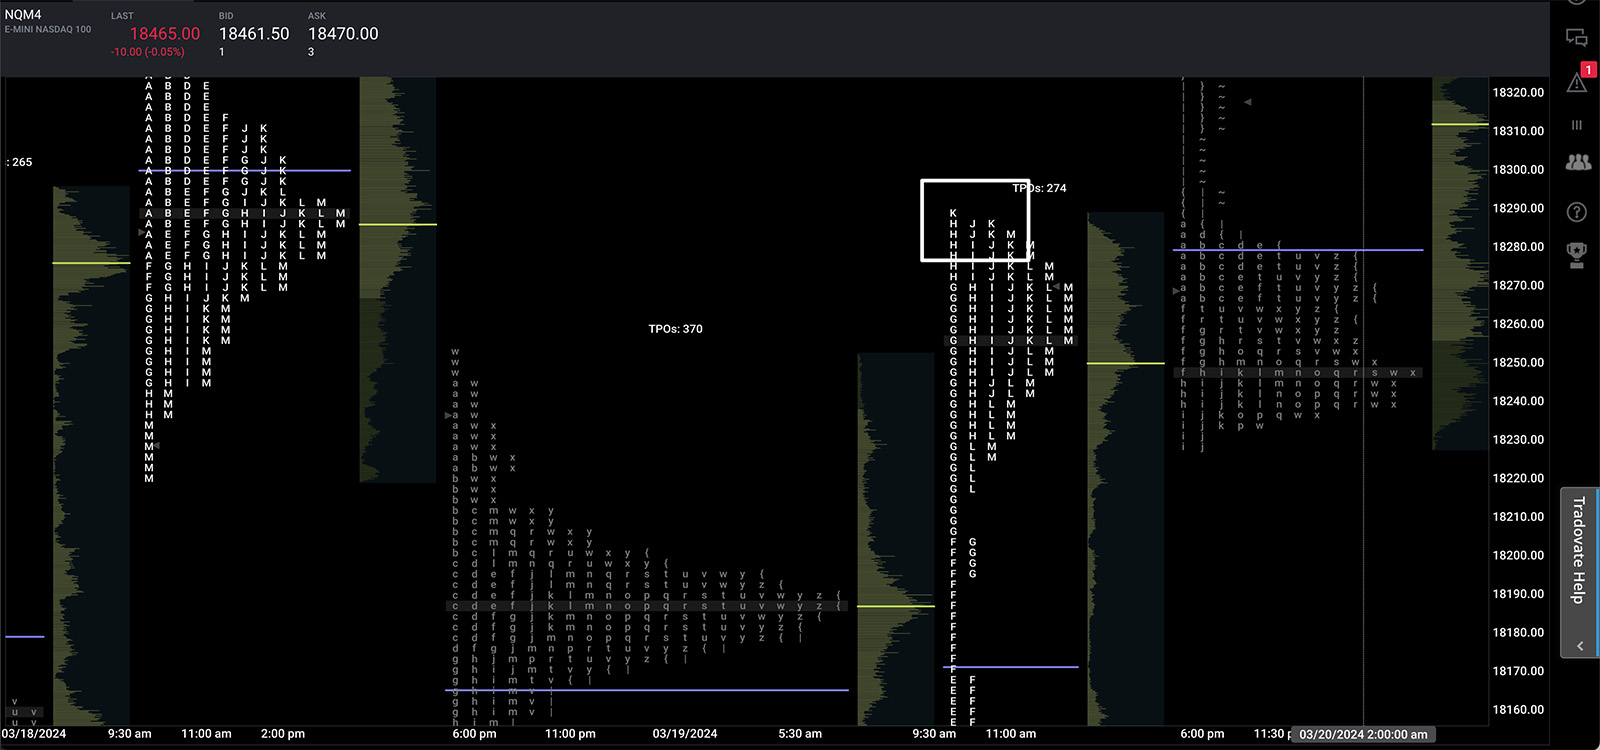
The implications are the same, but it’s not quite as clean as the precise poor high and poor low.
For more nuances on the market profile, read more from the godfather himself Jim Dalton. This book is dense, but a great thorough investigation of decades studying the auctioning of markets.