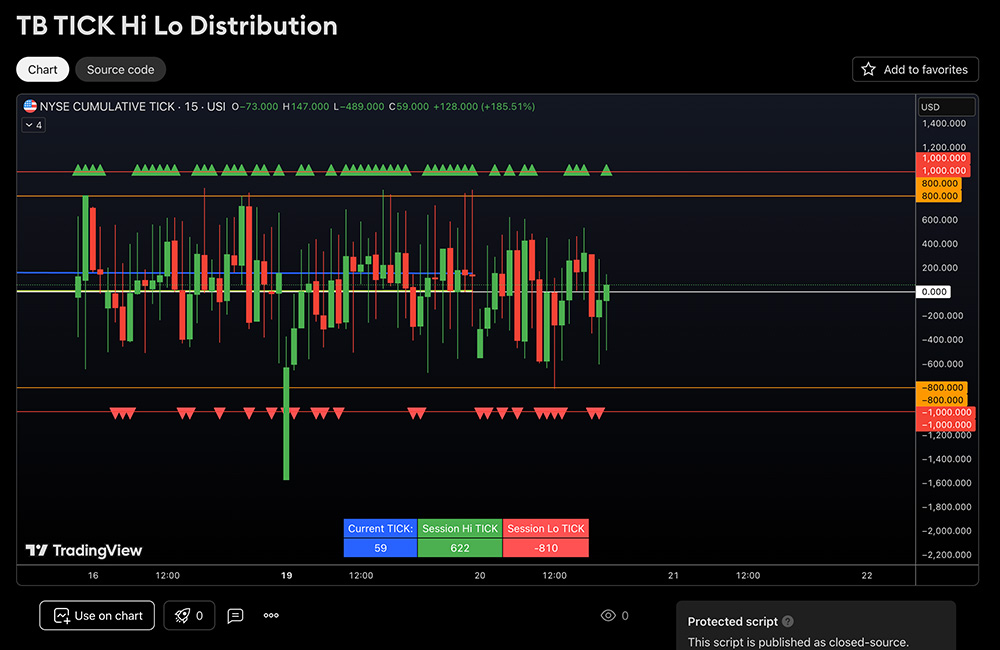
TICK Hi/Lo & Distribution (TradingView)
$0.00
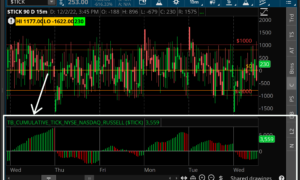
Plots the high and low TICK read of the day. Warns when TICK is above or below a threshold you determine. Triangles illustrate when the TICK has closed above or below the 0 line.
Quickly visualize the high and low TICK reads of the day as well as see a warning label when the TICK exceeds a threshold that you set.
The script also plots when the TICK closes above or below the 0 line with a triangle to at a glance determine what side of the trade is in control. This is NOT the same as the Cumulative TICK which gives an indication as to what degree buyers or sellers are in control and if its more indicative of trend.