Idea Generation vs. Idea Execution in Trading
Not every day in the market is a day to put on size and expect large returns. As a matter of fact, more often than not markets spend more time setting up a move instead of actually making the move itself. You can think of this as balance vs expansion. Range vs trend.
For us traders this means knowing when to go into idea generation mode versus idea execution mode. Typically out of five trading days, there might be only two trading days worth executing ideas on. If that’s the case, we better be darn sure that we are able to execute patience and not force ideas when markets aren’t really set up for a substantial move.
Signs of Idea Generation Mode
We typically become more reserved in our execution when markets are in balance and accepting nearby or recent prices. A good clue to switch into idea generation mode is if the stock, or index you are watching is going to open in the midpoint of the prior day’s range. Another layer would be opening inside of the prior day’s value area. This is especially true if the prior day’s range is large relative to the average true range. Under that circumstance, prices are familiar, and there should not be much shock and awe on the opening bell. This in turn will lead to more choppy price movement, and generally a lack of momentum.
This same concept can be scaled up to not just the midpoint of the prior day’s range, but the midpoint of a daily balance area. If the daily trend is non-existent, or price is not yet testing the extremes of a balance area, generally there is going to be more muted price action, and traders would want to focus more so on balance rules than anything else.
If you’re trading the mega cap tech companies, the market indexes should also be a big clue. For example, if Microsoft ($MSFT) is possibly setting up a move to breakout over resistance, but the Nasdaq 100 ($QQQ ETF) is in the middle of a balance range, it may not be advantageous to be an aggressive long looking for a momentum breakout in Microsoft.
Finally a lack of catalyst can also lead to market stagnation and no executable setups. This can happen when the market knows a large catalyst is on the horizon. Think about the days leading into CPI inflation reads. If CPI is on a Wednesday, sometimes the Monday and Tuesday sessions can lack volatility, as traders wait for more information out of the report.
On days where any of the above is true, the best course of action is to reduce position size, or avoid trading altogether. It may make more sense to let the price action develop into better setups that can be monitored into future trading sessions. If an inside bar forms on an idea generation day, that could come into play the following session if the inside bar range is broken. A classic example is the bull or bear 3 bar play.
A good tactic to use when in idea generation mode, is to make note of setups that are forming on some kind of watchlist.
Signs of Idea Execution Mode
The inverse of idea generation mode is typically true on day’s where there is a reason to be looking for strong trade setups to play out. Ideally we are opening on a gap outside of the prior day’s range, or opening disconnected from the prior day’s value area. The driver of the pre market movement could be a catalyst that changes investors or traders perception of fair value. The general idea is that the most advantageous days have some sort of imbalance that is trying to resolve.
For individual stocks, we ideally have the broad market attempting a breakout or breakdown in the same direction to add confluence, and therefore confidence to the move. To use the same example above, it would be ideal to look for a Microsoft breakout if the Nasdaq was also breaking out over the prior day’s high or some kind of daily structure. Strong reads out of the market internals in the direction of the move also support much more of an execution type of day.
When markets are signaling that they have much more of a capacity to trend, trading with normal or “full” position size would be warranted.
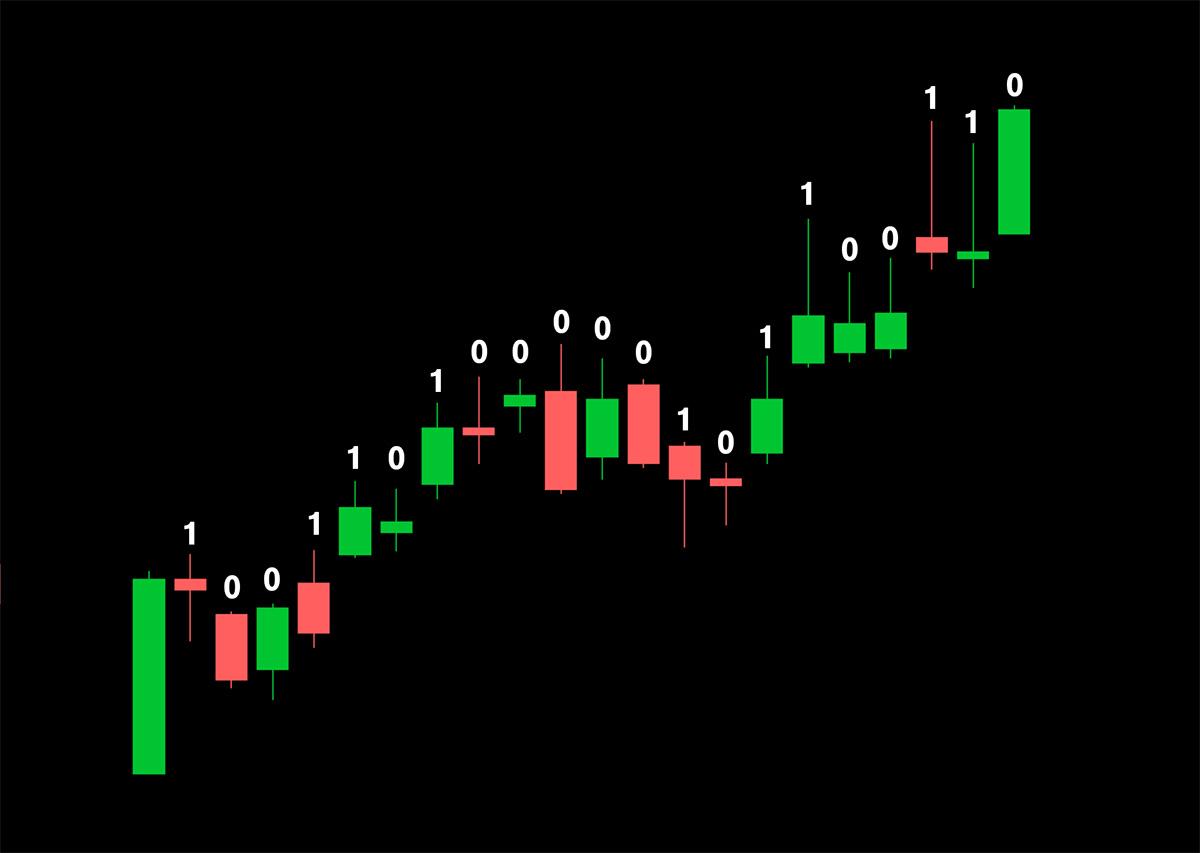
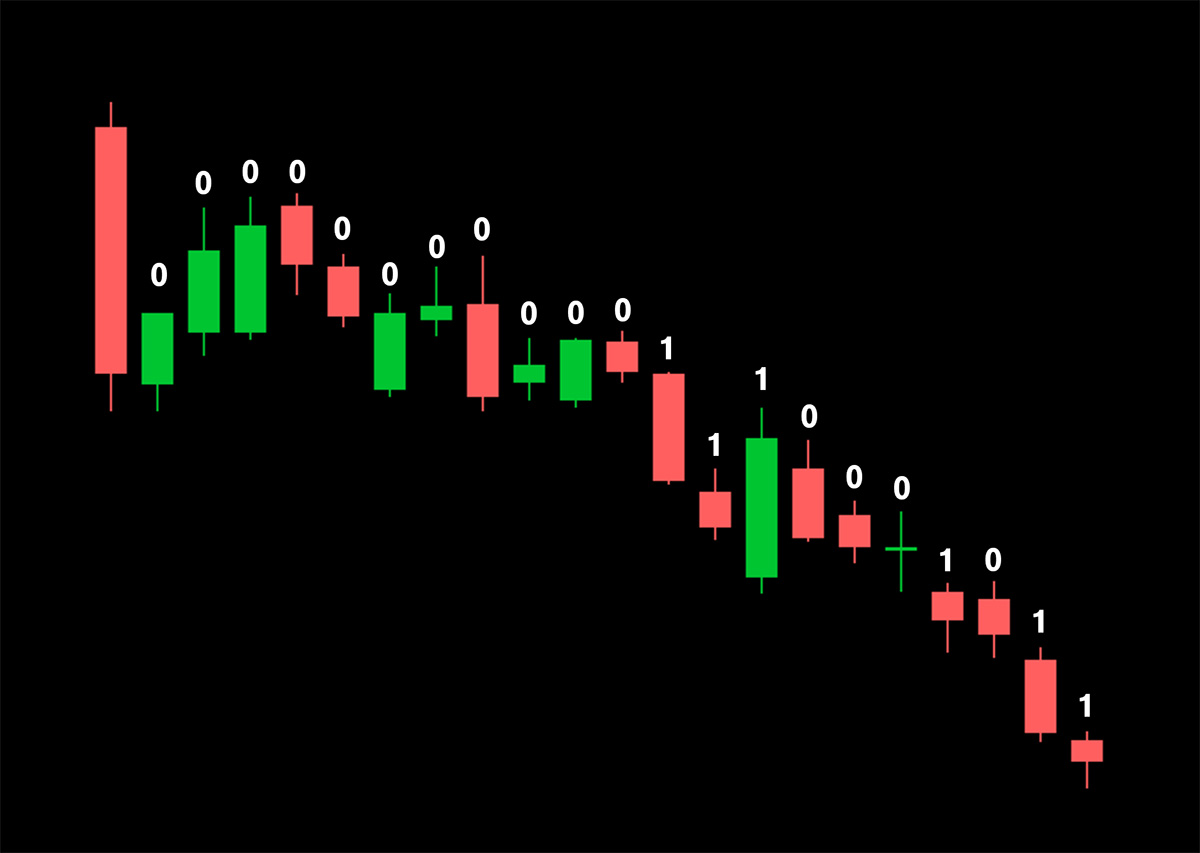
Examples
In the price action charts below, a 1 represents idea execution and a 0 represents idea generation days. Notice that there are more 0s than there are 1s.