Understanding The Basics of Candlestick Charts
Originating in 18th-century Japan, candlestick charts emerged as a practical tool for tracking the price of rice. Traders found a simple yet effective way to visualize market movements by representing open, high, low, and close prices through the use of candle-shaped symbols. Over time, this technique made its way into global financial markets and became a fundamental aspect of technical analysis. Each candlestick, with its distinct body and wicks, tells a concise story of how prices fluctuated during a specific period. Today, these historical charts remain a cornerstone for traders seeking insights into market trends and potential price reversals.
Components of Candlestick Charts
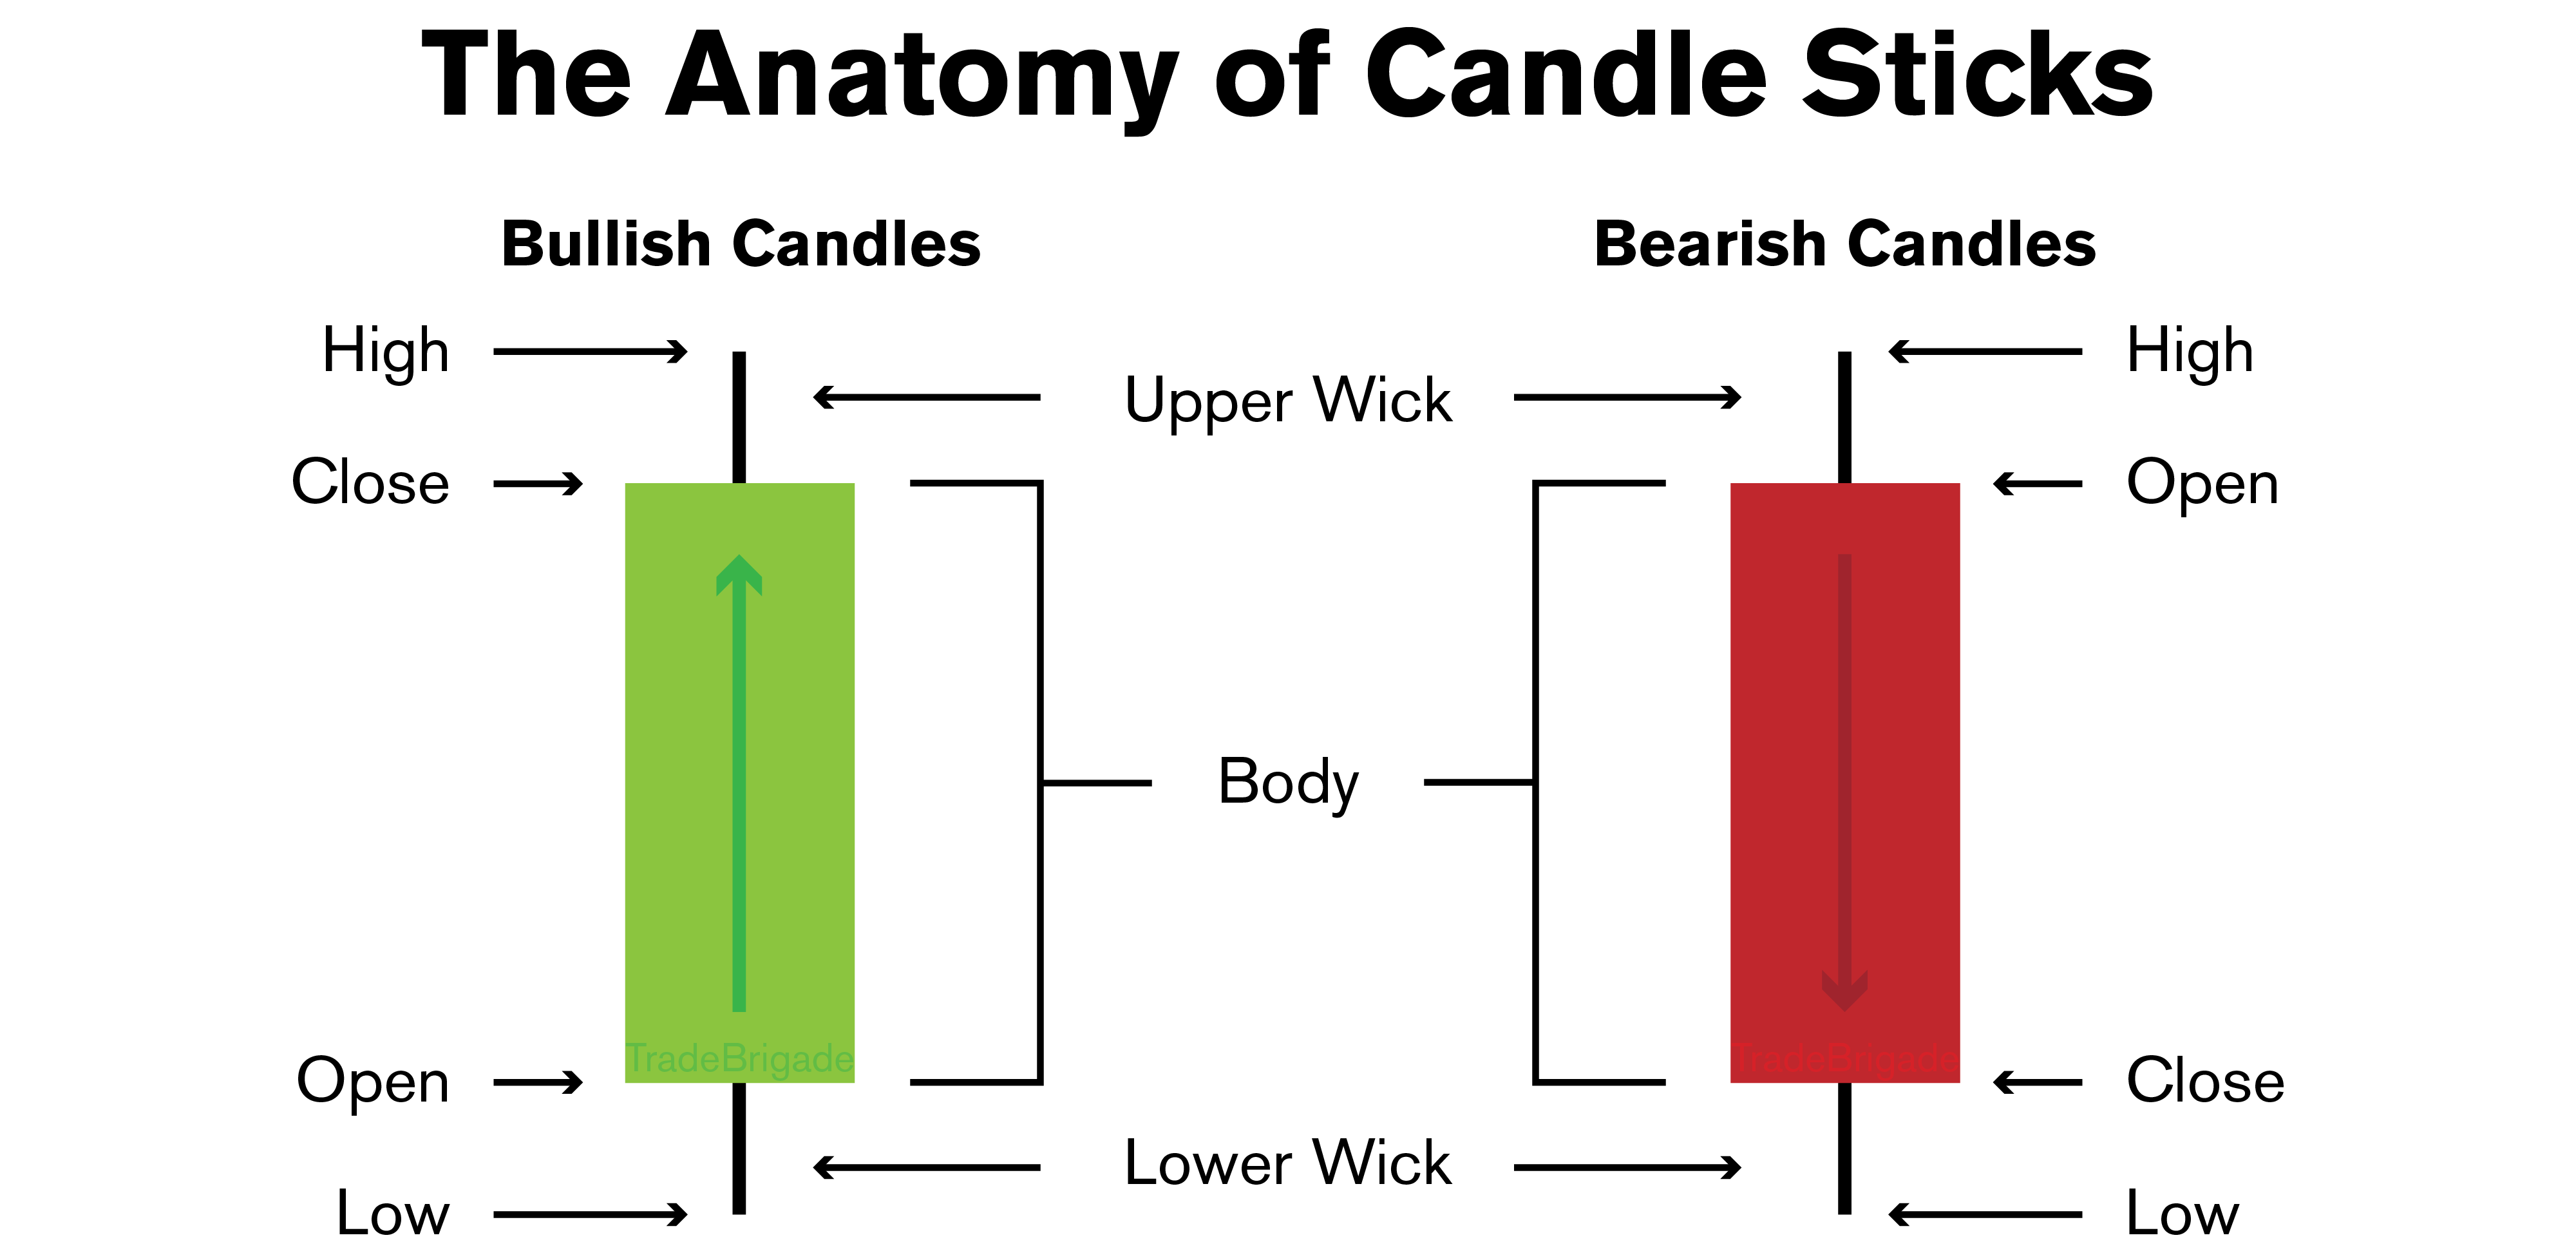
A candlestick consists of three main components: the body, the wick (or shadow, or tail), and the color. The body represents the price range between the opening and closing of a specific time period. If the closing price is higher than the opening, the body is typically colored green, indicating a bullish (upward) movement. Conversely, a red body suggests a bearish (downward) movement when the closing price is lower than the opening.
The wick, or shadow, extends from the top and bottom of the body and represents the highest and lowest prices reached during the same time frame. Essentially, it encapsulates the entire price range for that period. The upper wick extends above the body, indicating the highest price, while the lower wick extends below the body, marking the lowest price. Together, the body and wicks provide a visual snapshot of how prices fluctuated, offering valuable insights into market dynamics.
Common Candlesticks
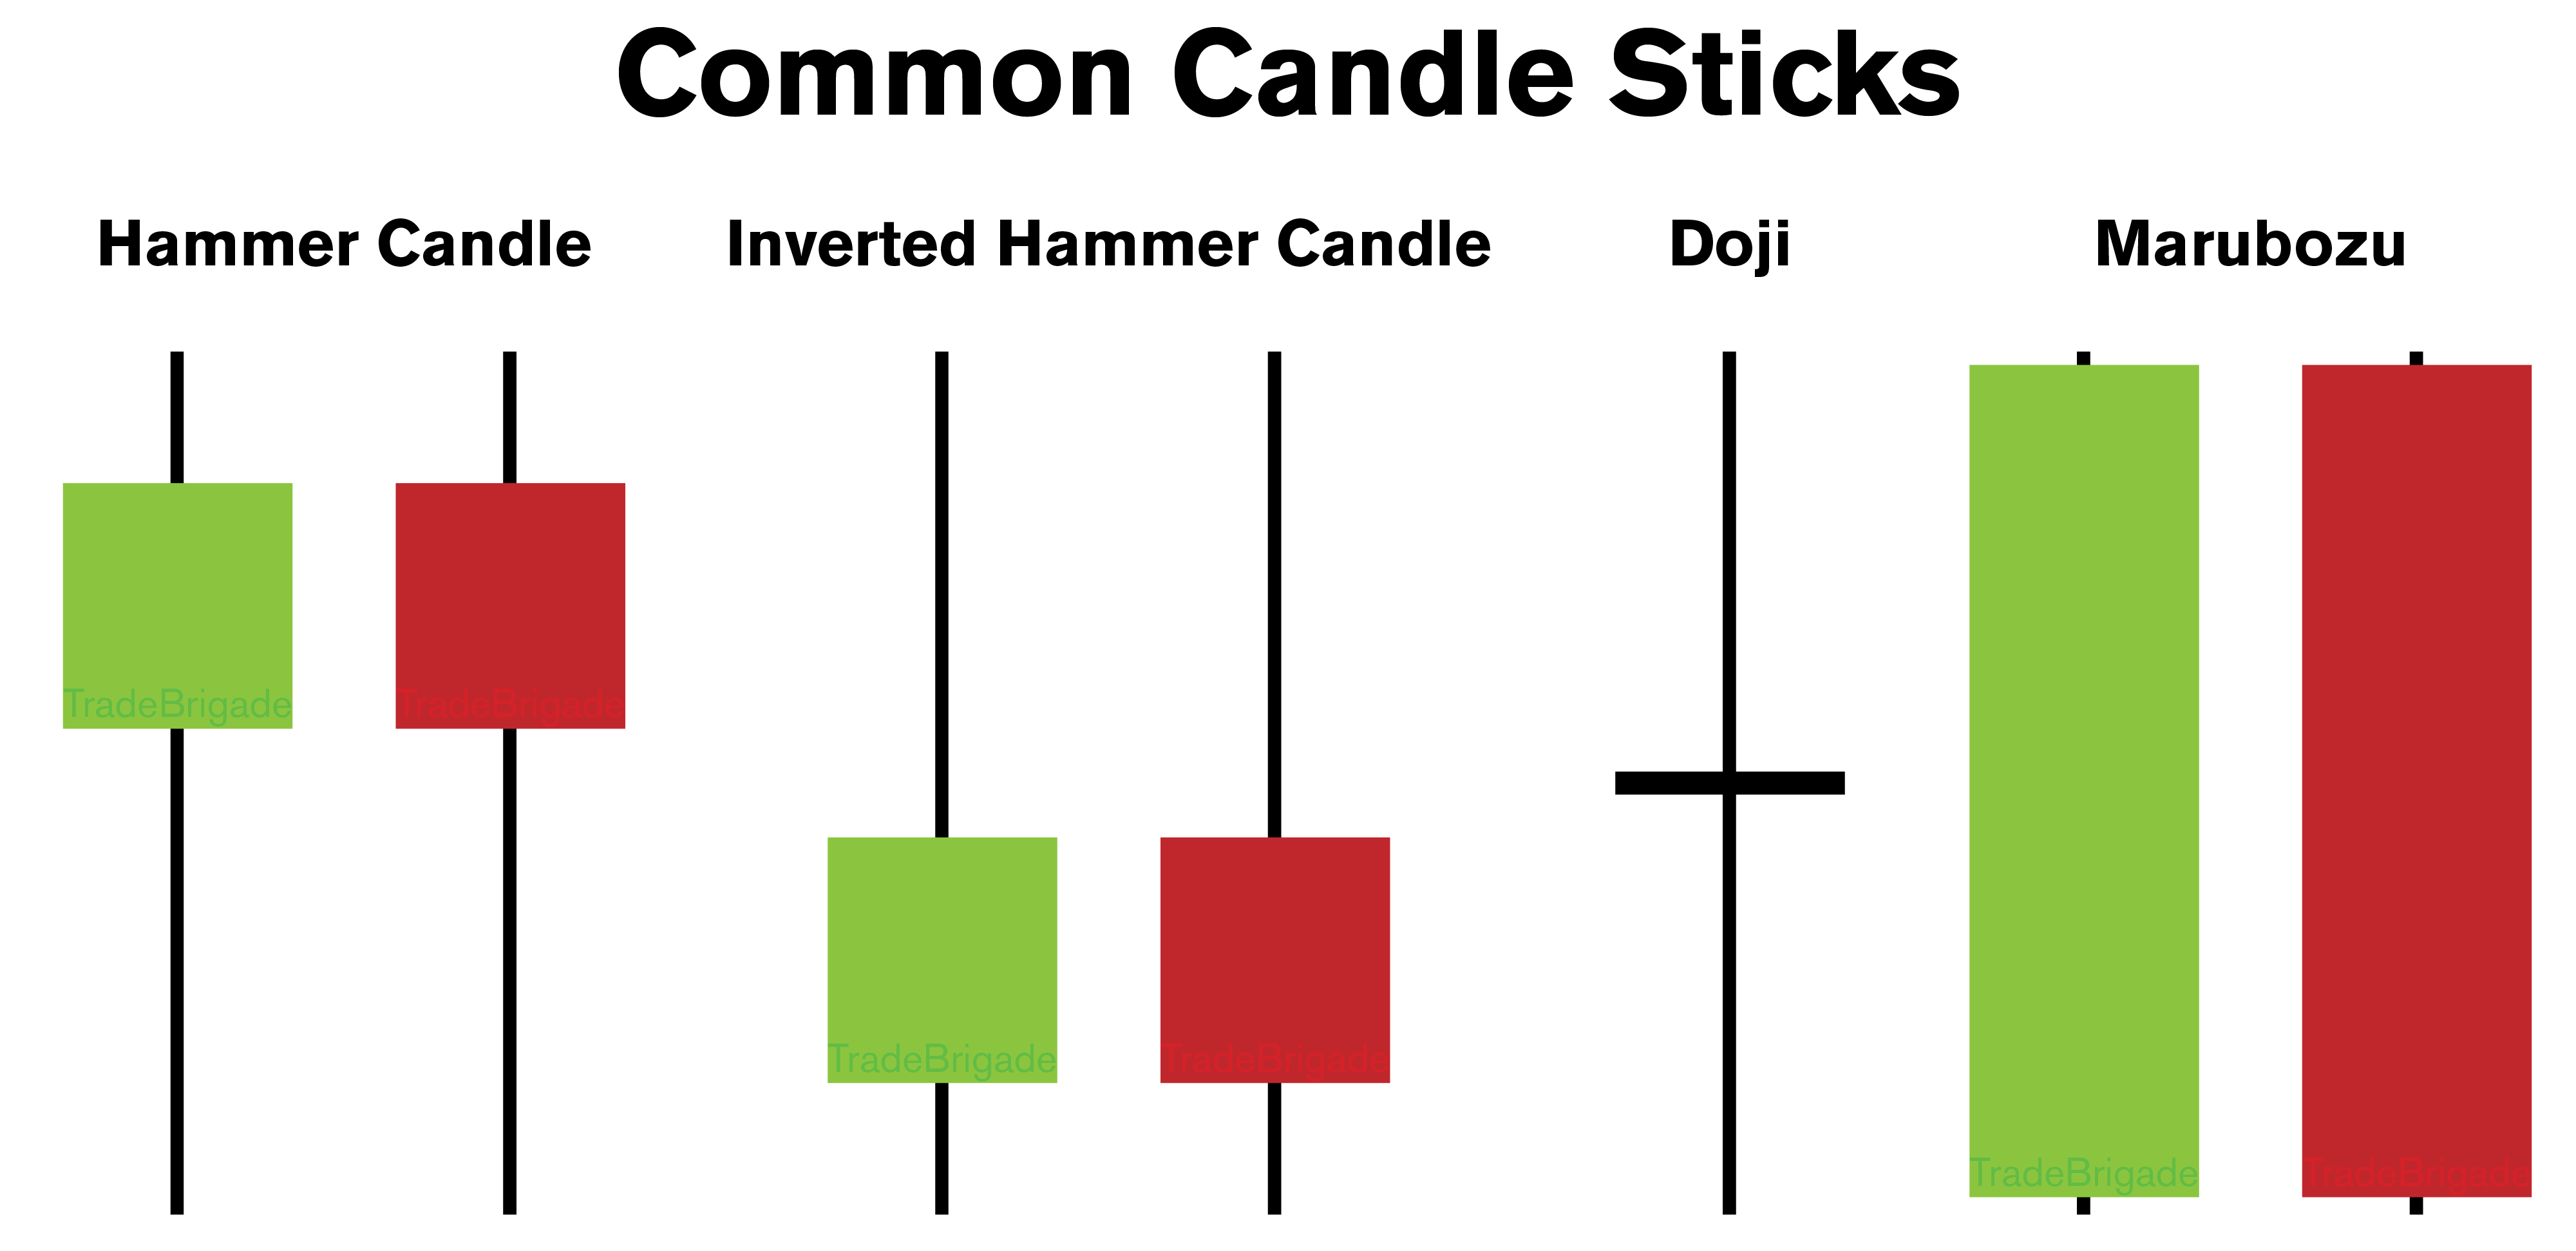
A Hammer is a single candlestick pattern characterized by a small body and a significant lower wick, resembling the shape of a hammer. This pattern typically suggests a potential reversal in a downtrend, signaling that despite bearish efforts, bulls managed to drive the price up by the end of the period.
Conversely, an Inverted Hammer shares a similar appearance but occurs at the top of an uptrend, indicating a potential reversal to the downside. It represents a market shift where sellers step in to push the price lower, despite initial buying pressure.
A Doji is a candlestick pattern with a small or nonexistent body, indicating an equal opening and closing price. This pattern suggests indecision in the market, as buyers and sellers reached a temporary standoff. It’s like a pause button, signaling potential changes in momentum and the need for traders to exercise caution.
On the other hand, a Marubozu is a candlestick with little to no wicks, featuring a long body that represents a strong and decisive price movement. A bullish Marubozu indicates a strong upward trend with the closing price at the day’s high, while a bearish Marubozu suggests a powerful downtrend with the closing price near the day’s low.
Multiple Candle Patterns
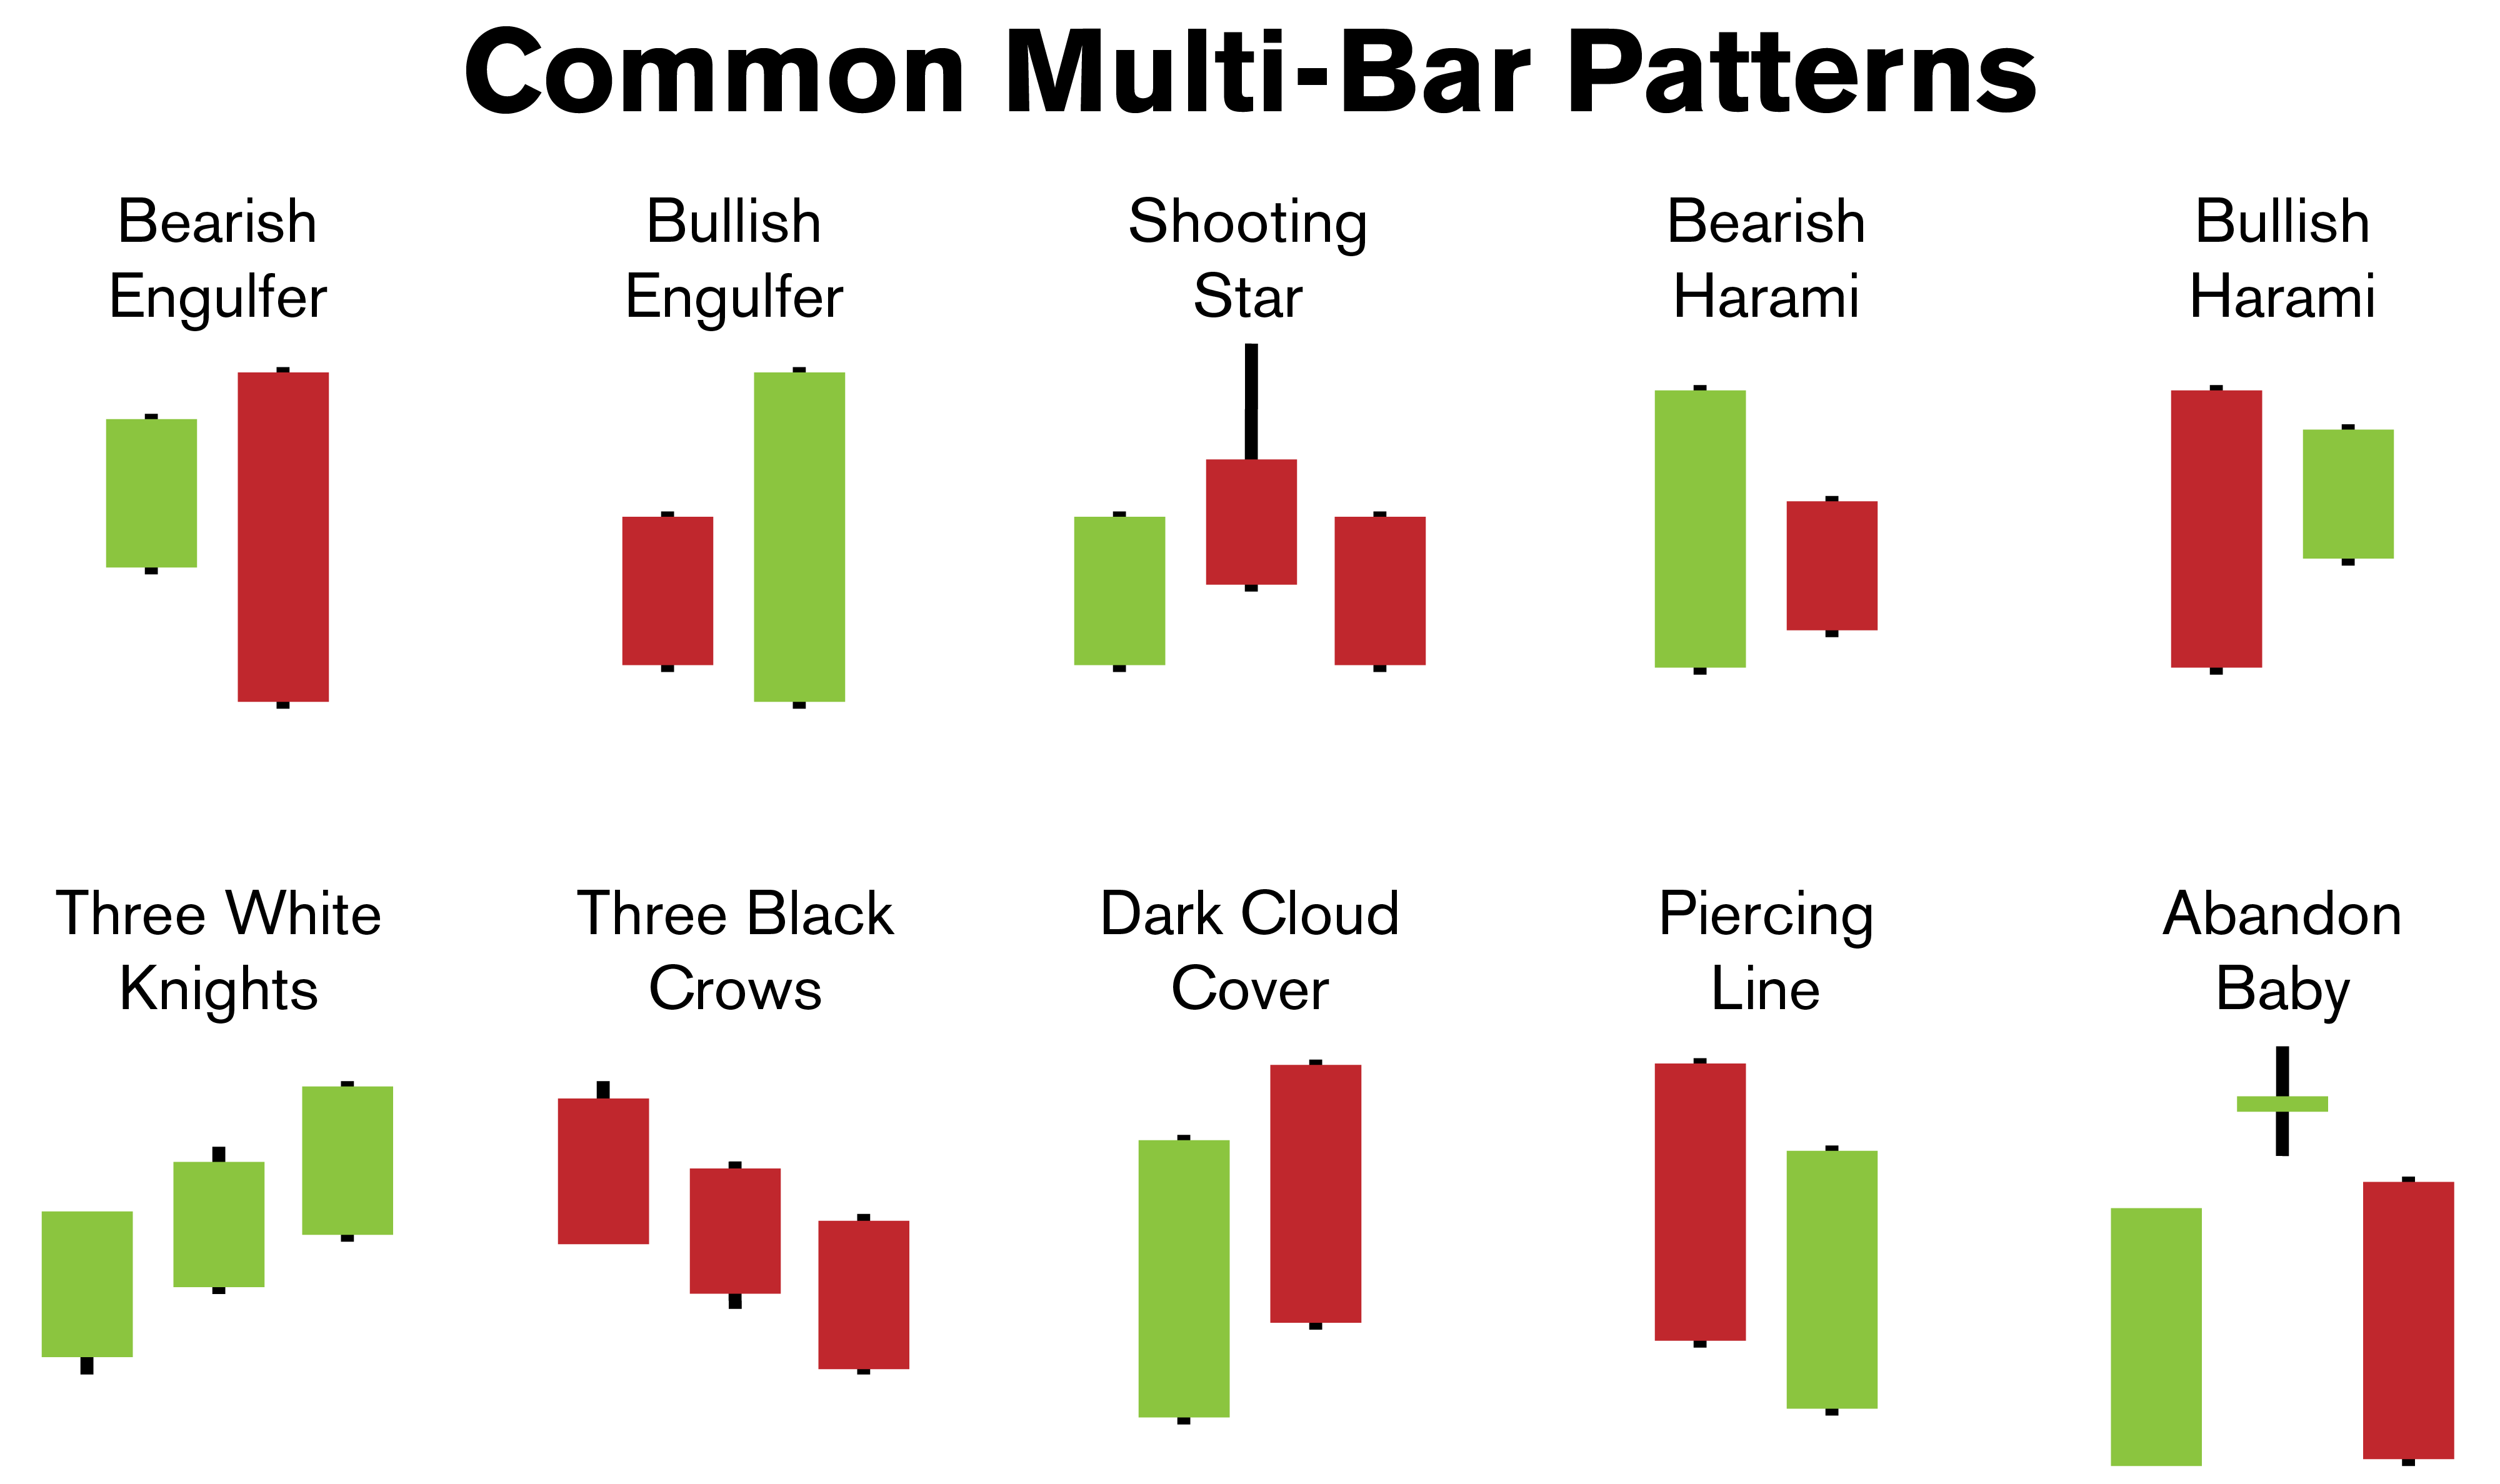
A Bearish Engulfing pattern occurs when a smaller bullish candle is entirely overshadowed by a larger bearish candle, indicating a potential reversal from an uptrend to a downtrend. This formation suggests that selling pressure has intensified, leading to a shift in market sentiment. Conversely, a Bullish Engulfing pattern is characterized by a smaller bearish candle followed by a larger bullish candle, signaling a potential reversal from a downtrend to an uptrend. In this case, the bullish momentum has overwhelmed the bears, pointing to a change in market sentiment.
The Shooting Star is a bearish reversal pattern featuring a small body and a long upper wick, resembling an inverted hammer candle. This pattern occurs after an uptrend and suggests a potential reversal, indicating that buyers attempted to push the price higher but faced significant selling pressure, resulting in a bearish turnaround.
A Bullish Harami is a two-candle pattern where a small bullish candle is engulfed by a larger bearish candle. This formation suggests a potential reversal from a downtrend to an uptrend, signaling a shift in market sentiment. Conversely, a Bearish Harami occurs in an uptrend, indicating a potential reversal to the downside.
The Three White Knights pattern is a bullish reversal formation characterized by three consecutive long and bullish candlesticks, symbolizing a strong shift from a downtrend to an uptrend. On the flip side, the Three Black Crows is a bearish reversal pattern featuring three consecutive long and bearish candlesticks, signaling a potential reversal from an uptrend to a downtrend. These patterns provide clear visual cues of market sentiment transitions.
The Dark Cloud Cover is a bearish reversal pattern formed by a bullish candle followed by a larger bearish candle that partially engulfs the preceding candle. This formation signals potential downward momentum as sellers gain control after an uptrend. Conversely, the Piercing Line is a bullish reversal pattern where a bearish candle is followed by a larger bullish candle that penetrates the midpoint of the previous candle. This formation suggests a potential reversal from a downtrend to an uptrend, indicating a shift in market sentiment.
Tweezer Tops and Bottoms are reversal patterns formed by two consecutive candlesticks with equal highs (Tweezer Tops) or lows (Tweezer Bottoms). Tweezer Tops indicate potential bearish reversals, suggesting that buyers failed to push the price higher. On the other hand, Tweezer Bottoms suggest potential bullish reversals, indicating that sellers couldn’t drive the price lower.
The Abandoned Baby Reversal is a three-candle pattern characterized by a gap, a Doji, and another gap, signaling a potential reversal. This formation suggests a sudden shift in market sentiment, with the Doji reflecting indecision before the reversal.
Conclusion
Understanding the basics of candlestick charts provides traders with a powerful tool to navigate the complexities of financial markets. From their origin in the rice trade, these charts have evolved into a fundamental aspect of technical analysis, offering a straightforward visual representation of market movements. With components like the body, wick, and color, each candlestick tells a concise story of price fluctuations during a specific period, empowering traders with valuable insights. From single candlestick patterns like the Hammer and Doji to more complex multi-candle formations such as the Engulfing patterns and Three White Knights, these visual cues serve as indicators of potential trend reversals. Whether identifying bullish or bearish signals, the simplicity of candlestick analysis makes it accessible to traders at all levels.
For those eager to delve deeper into the world of technical analysis and enhance their trading skills, consider exploring an in-depth training on this subject here: Technical Analysis Bootcamp.