The Power of Anchored VWAP in Technical Analysis
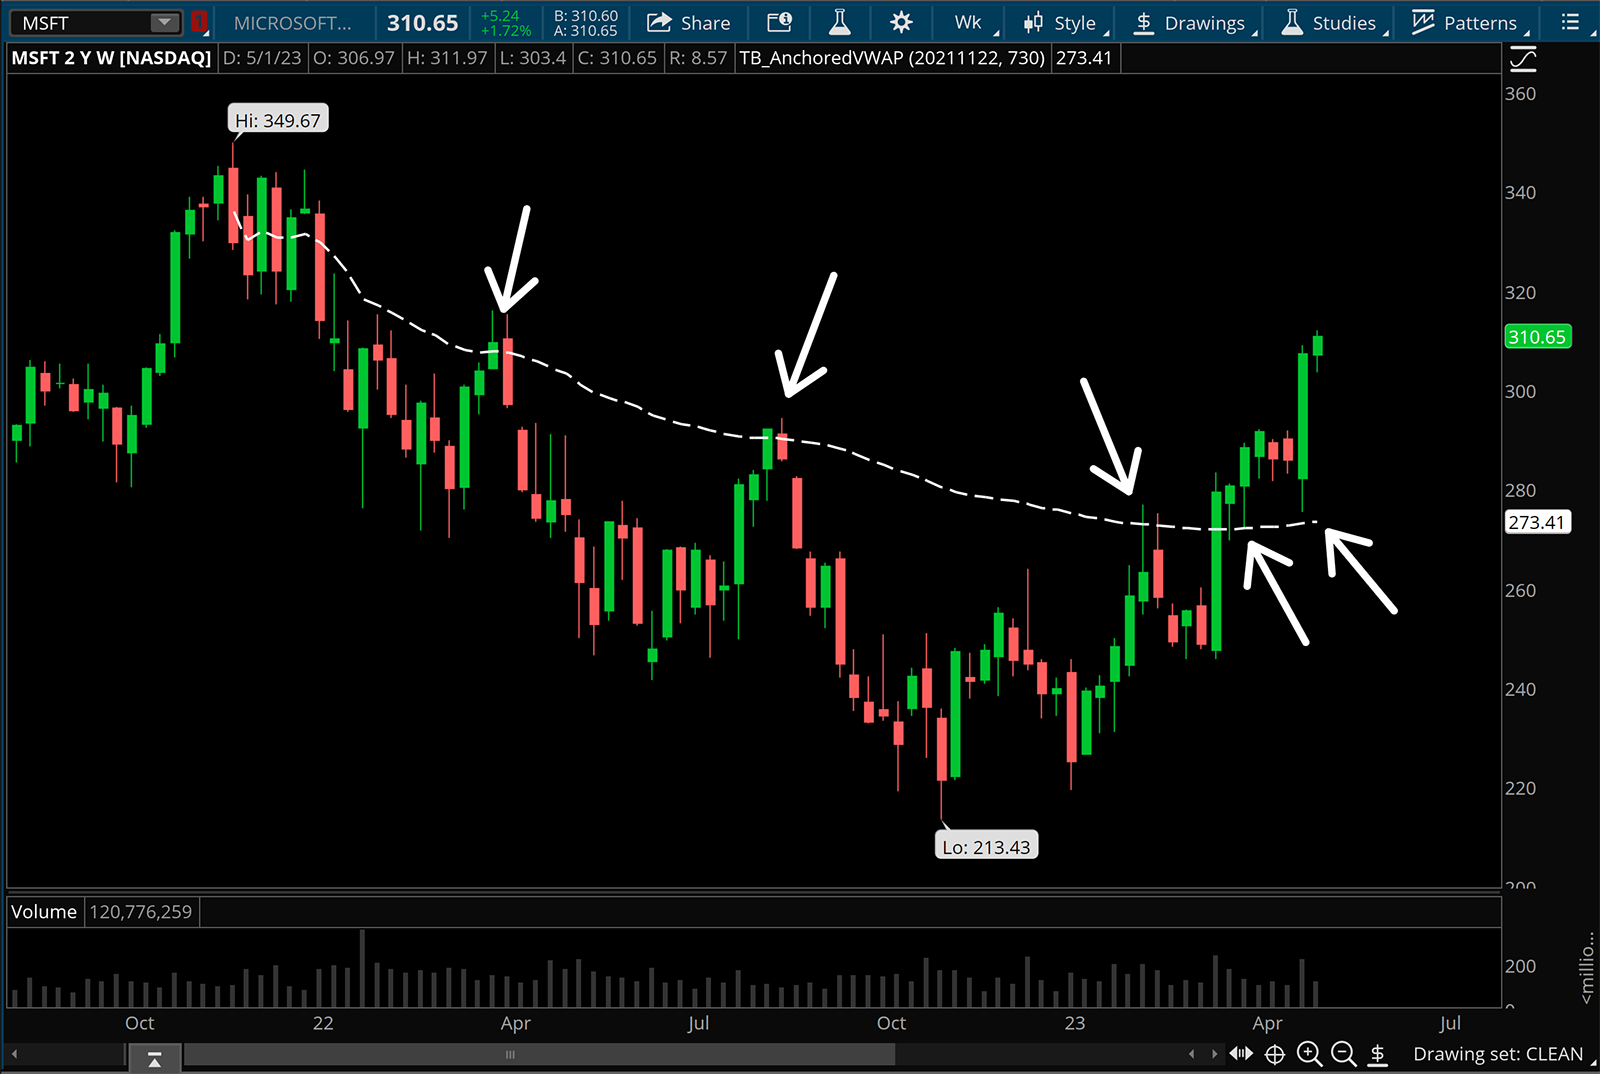 Microsoft anchored VWAP from all time high on the weekly timeframe chart offers multiple trading opportunities.
What is VWAP?
The volume-weighted average price, also known as VWAP, is one of the strongest trading indicators used by traders and investors. VWAP is calculated by totaling the value in dollars traded for every transaction (price multiplied by the volume) and then dividing by the total shares traded. The inputs to the calculation are constant and totally objective: price, volume, and time. Price in relationship to the VWAP is also objective. Price is either above, or below. Thus, if VWAP is an objective calculation, and a representation of where the “average” buyer or seller is holding a position from, we can conclude that VWAP can tell us about the psychology of market participants.
The VWAP is traditionally calculated from the start of major aggregation periods, with common reset times including 9:30 am for intraday VWAP, Monday for weekly VWAP, and the first of the month for monthly VWAP. However, this approach is limiting as it doesn’t account for starting at a custom location. This is where the anchored VWAP comes in, allowing traders to anchor the calculation to a specific point, generating more nuanced analysis. The anchor point can be any significant price level such as swing highs and lows, or even a significant date where the market moved based on some catalyst. Using this approach traders can understand more accurately the fair value of an asset based on a specific time-frame or pivot.
How can anchored VWAP be used in trading?
The simplest way to use anchored VWAP is for trend analysis. When the current price of an asset is above the anchored VWAP, it indicates a bullish trend, and when it is below the anchored VWAP, it indicates a bearish trend. This assumption comes from the fact that the “average participant” (another way to think about the VWAP) is making or losing money based on what side of VWAP markets are trading. If we are above the anchored VWAP, the average long buyer is making money, and the average short seller is losing money, thus we assume bulls are in control. The same is true but opposite when price is under the anchored VWAP.
Another way to use the anchored VWAP is to identify potential areas of support and resistance. If an asset is testing the anchored VWAP from above, there are two things to consider; what is the trend, and how do traders get involved? First, we know that being above the anchored VWAP represents the asset being in an uptrend. Buyers who have an entry price better than the anchored VWAP may consider adding to their position at the anchored VWAP instead of paying a “premium” when price is extended above the anchored VWAP. Buyers who are not yet involved may look at the opportunity to get into a new position at the anchored VWAP as more favorable than paying a “premium” when price is extended above the anchored VWAP. The same thing is true but opposite for sellers when testing the anchored VWAP from below.
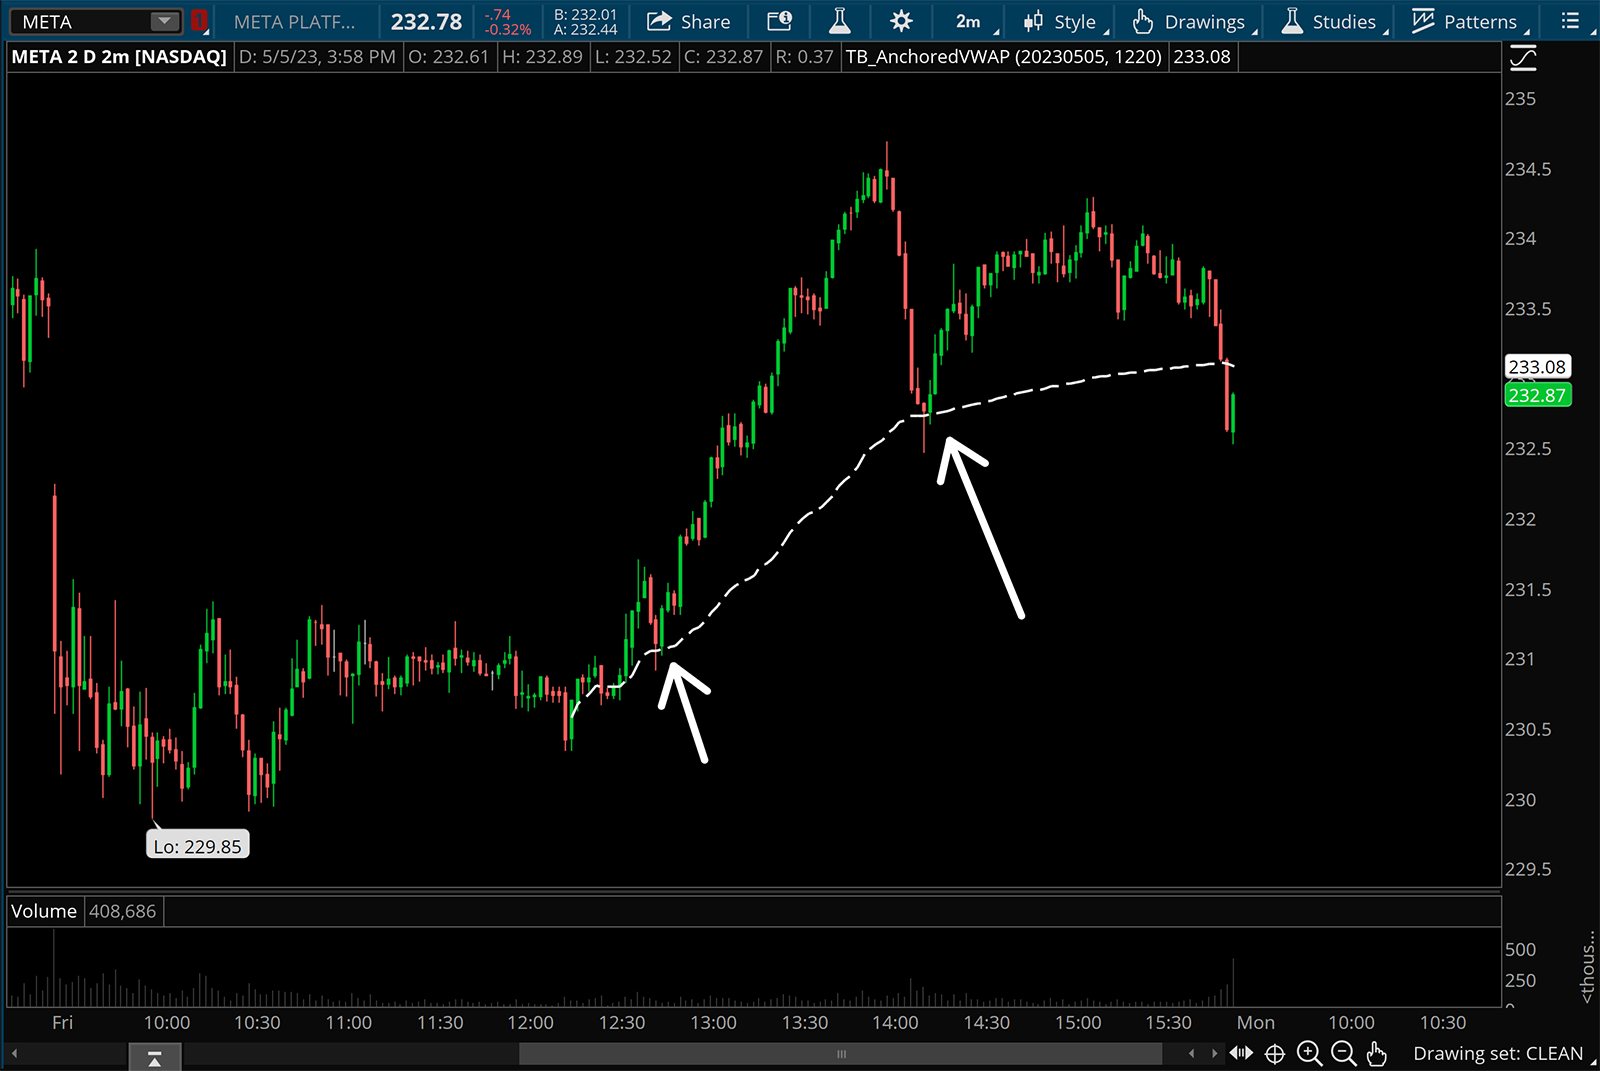 Meta offers multiple entry points at the anchored VWAP after a fake breakdown.
Finally, if we know that the anchored VWAP can tell us the trend direction and possible support and resistance zones, logic says these would also be favorable areas for entries and exits. When the price of an asset crosses above or below the anchored VWAP, it can signal a change in trend and thus a shift in who is in control of the trade. As a buyer, you may look to place an entry at or slightly above the anchored VWAP and a stop loss slightly below the anchored VWAP. You have defined risk, and know that the thesis of the trade can be invalidated by failing to hold above the anchored VWAP on the bull side. Once again, the same can be true but opposite for sellers beneath the anchored VWAP.
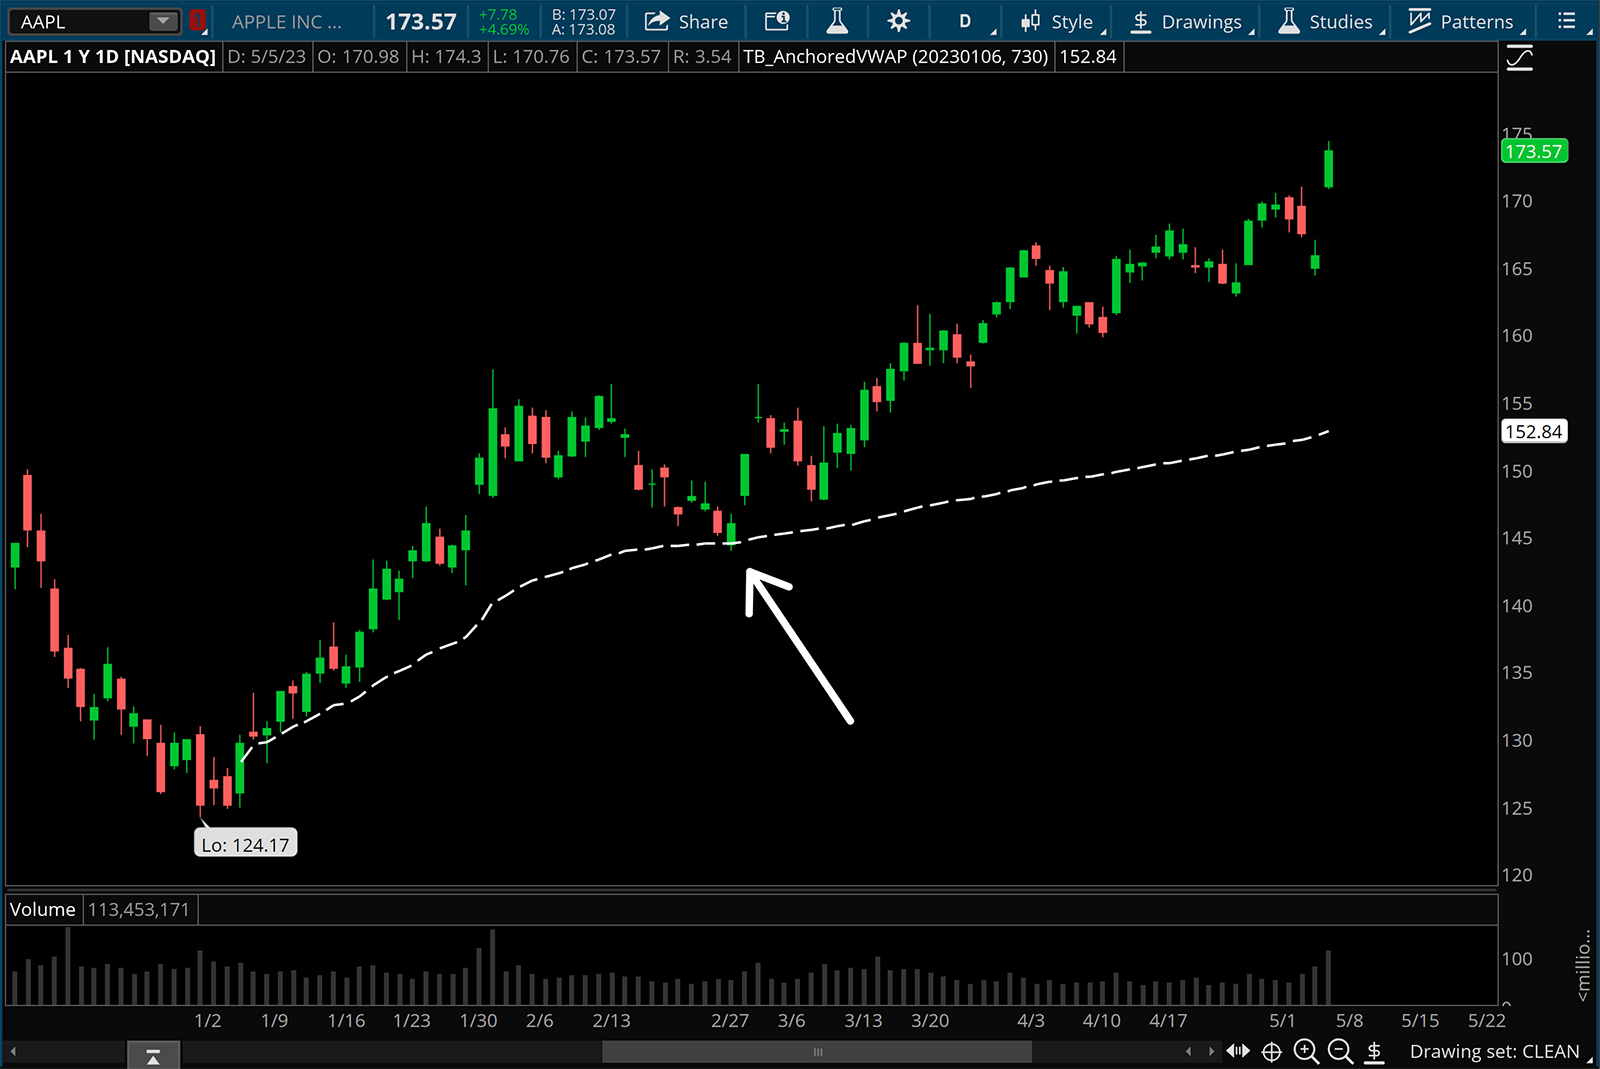 AAPL offers a daily entry near the anchored VWAP after the reversal from the lows was established.
The anchored VWAP is a powerful tool in technical analysis that provides a more nuanced view of the fair value of an asset over a specific period, starting from a significant point that you have control over. It’s important to note that the anchored VWAP by itself is not a trading strategy, and should be paired with other types of analysis to make informed trading decisions. However, using the anchored VWAP, traders can add a layer of context to trends, support and resistance zones, and potential areas to execute entries and exits.