Look Above and Fail
If you’re new to trading or even if you’ve been in the game for a while, you might have heard the term “look above and fail” but aren’t quite sure what it means. This concept is particularly relevant when trading within a balance range, which is common when markets are stuck potentially waiting for a catalyst. A fundamental understanding of price action analysis should always ground your strategy but let’s break it down in simple terms.
What is a Balance Range?
A balance range in trading refers to a period where a stock’s price movement is contained within a relatively stable range. Think of it like a horizontal channel where the stock price respects a clear resistance level, and a clear support level for an extended period of time. Read more about drawing support and resistance.
What Does ‘Look Above and Fail’ Mean?
When we talk about a stock “looking above and failing,” we’re describing a price move where price approaches or slightly exceeds the resistance level but then falls back down without breaking through decisively. Here’s how it works:
- Approach to Resistance: Price climbs up towards the resistance level. Traders watch this closely because if there is a break through this level, it could signal a new potential uptrend on the breakout.
- Slight Exceedance: The price should go a little above this resistance. This is the “look above” part. Ideally new money buyers are piling into the stock, ETF, or index.
- Failing to Break Through: Despite going above, the stock price doesn’t hold above the resistance. Instead, it falls back into the balance range or even below. This is the “fail” part. We want to avoid setting a higher low above the resistance level.
- Confirmation: The failure is confirmed when price sets a lower high back below the resistance level confirming that buyers who attempted to participate in the breakout are trapped.
Why Does This Happen?
Several reasons can explain why a stock looks above and fails:
Profit-Taking: Investors who bought the stock at lower prices might sell to lock in profits once the price hits or slightly exceeds the resistance.
Skepticism: Some traders might not believe the stock will sustain above the resistance, leading them to sell or short the stock, pushing the price back down.
Lack of Volume: If there isn’t enough buying interest or volume when the stock hits resistance, it can fail to break through.
How to Trade This Scenario?
The ‘look above and fail’ should be a staple in any traders playbook. You can participate in the action by looking for the confirmation lower high under the level after a false breakout has taken place. The target of a look above and fail is always the bottom end of the original balance area, in this case the original support level.
Hypothetical and Real Example
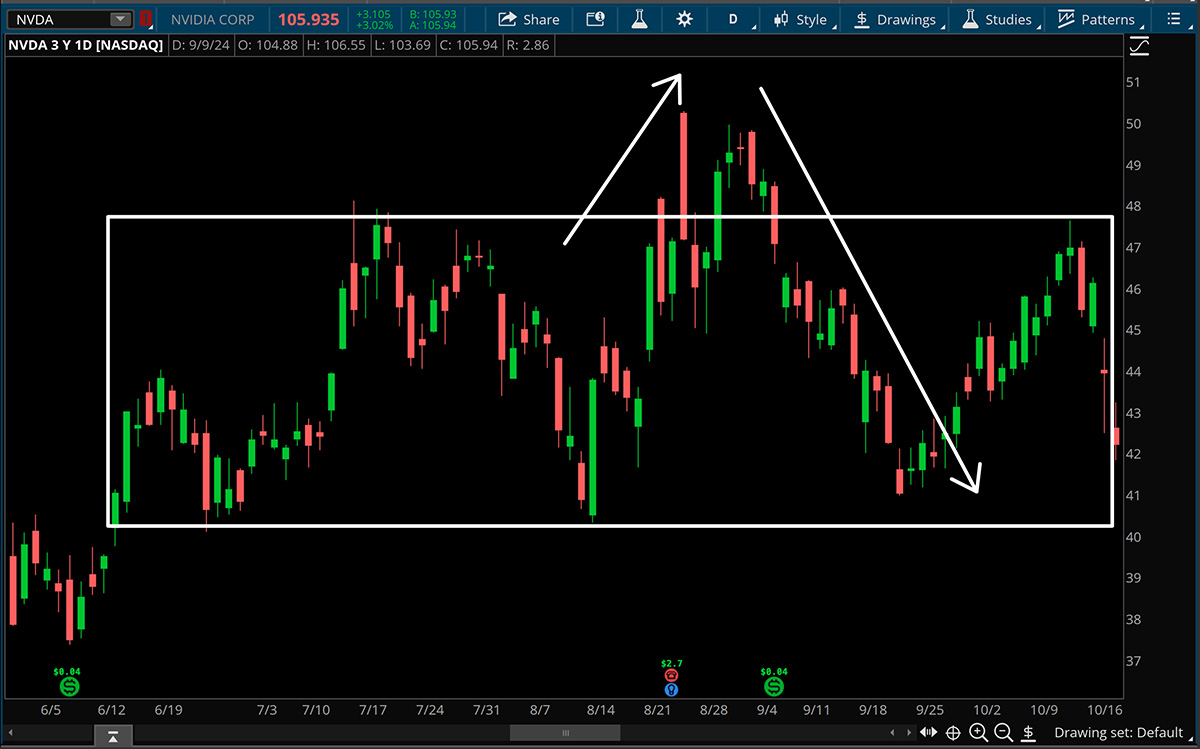
Imagine Company X’s stock has been trading between $50 (support) and $60 (resistance) for months. One day, the stock price hits $62 but then drops back to $58 within the same trading day. This is a classic “look above and fail” scenario. You might decide to short the stock, expecting it to return to $50 or lower, or wait for another attempt at breaking $60 to confirm a trend change.
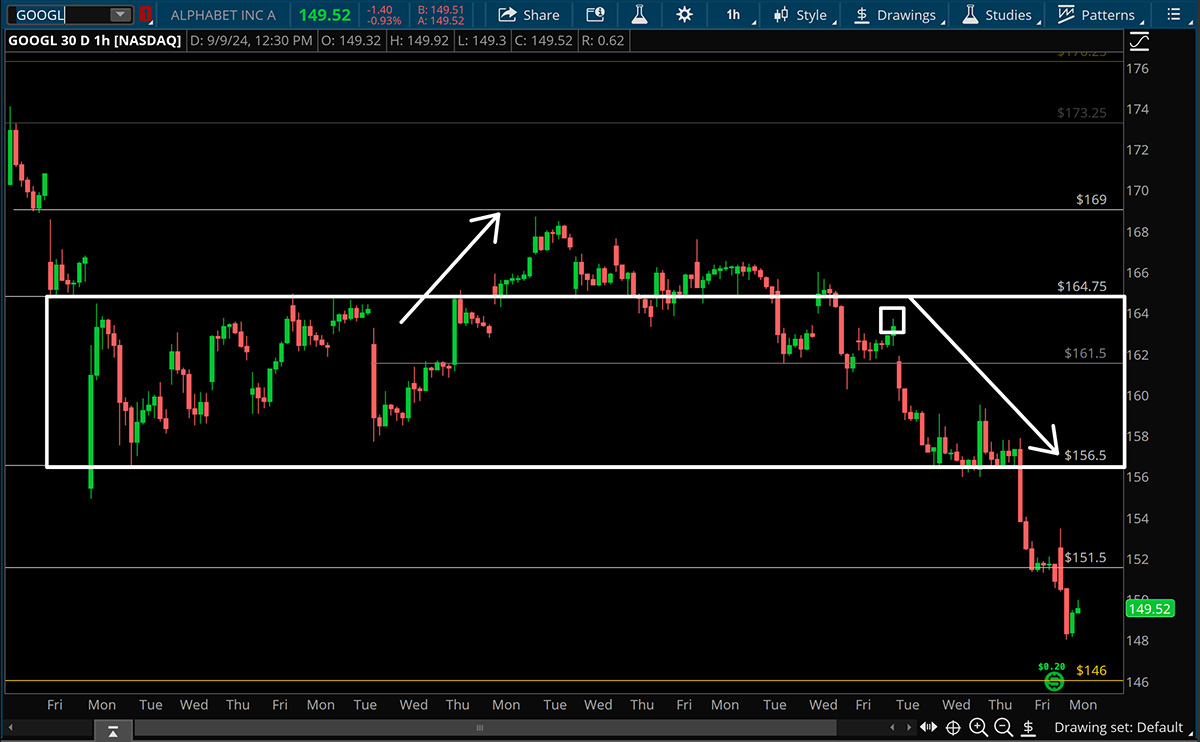
In the below real world example, we can see Google had developed a balance range between 164.75 and 156.5. It tried to break out over the top of the balance, but failed back below. In the small white box we can see the lower high that was set back down inside of the range, and subsequent move to the bottom end of the balance. This is a textbook completion of the pattern.
Conclusion
The “look above and fail” concept is crucial for traders who focus on range-bound stocks. Recognizing this pattern can help take advantage of unsuccessful breakout attempts, or at least avoid getting trapped.