Implied Volatility vs. Implied Volatility Rank
Implied volatility (IV) and implied volatility rank (IVR) are two similar but different metrics in options trading. Implied volatility represents the actual capacity for options pricing to move, whereas implied volatility rank shows if the implied volatility is high or low based on historic comparison. It is not actually the implied volatility amount. Let’s take a closer look at exactly what this means.
Implied Volatility (IV)
Implied volatility is a metric in options trading that represents the market’s expectation of future price movement for a particular asset, and is often expressed as IV. It’s a measure of the anticipated volatility in the price of an option contract, that comes from the options market, not historical price movement of the underlying asset.
Implied volatility shows how traders feel about the potential magnitude of future price swings. If implied volatility is high, it represents lots of uncertainty, compared to when its low, and expectations are stable. Implied volatility is based on multiple factors such as upcoming events, market sentiment, and most importantly supply and demand for the options. As an example, if implied volatility is reading at 25%, the expectation is that the options contract will have ±25% price fluctuations at or before the expiration.
Implied volatility is typically derived using option pricing models, with the Black-Scholes model being one of the most commonly used. This model, along with its variations, takes into account factors such as the current stock price, strike price, time to expiration, risk-free interest rate, and dividends to estimate the theoretical value of an option. Don’t worry about doing these calculations, as most brokers will show you the IV in the options chain. It is just useful to understand where the number is coming from.
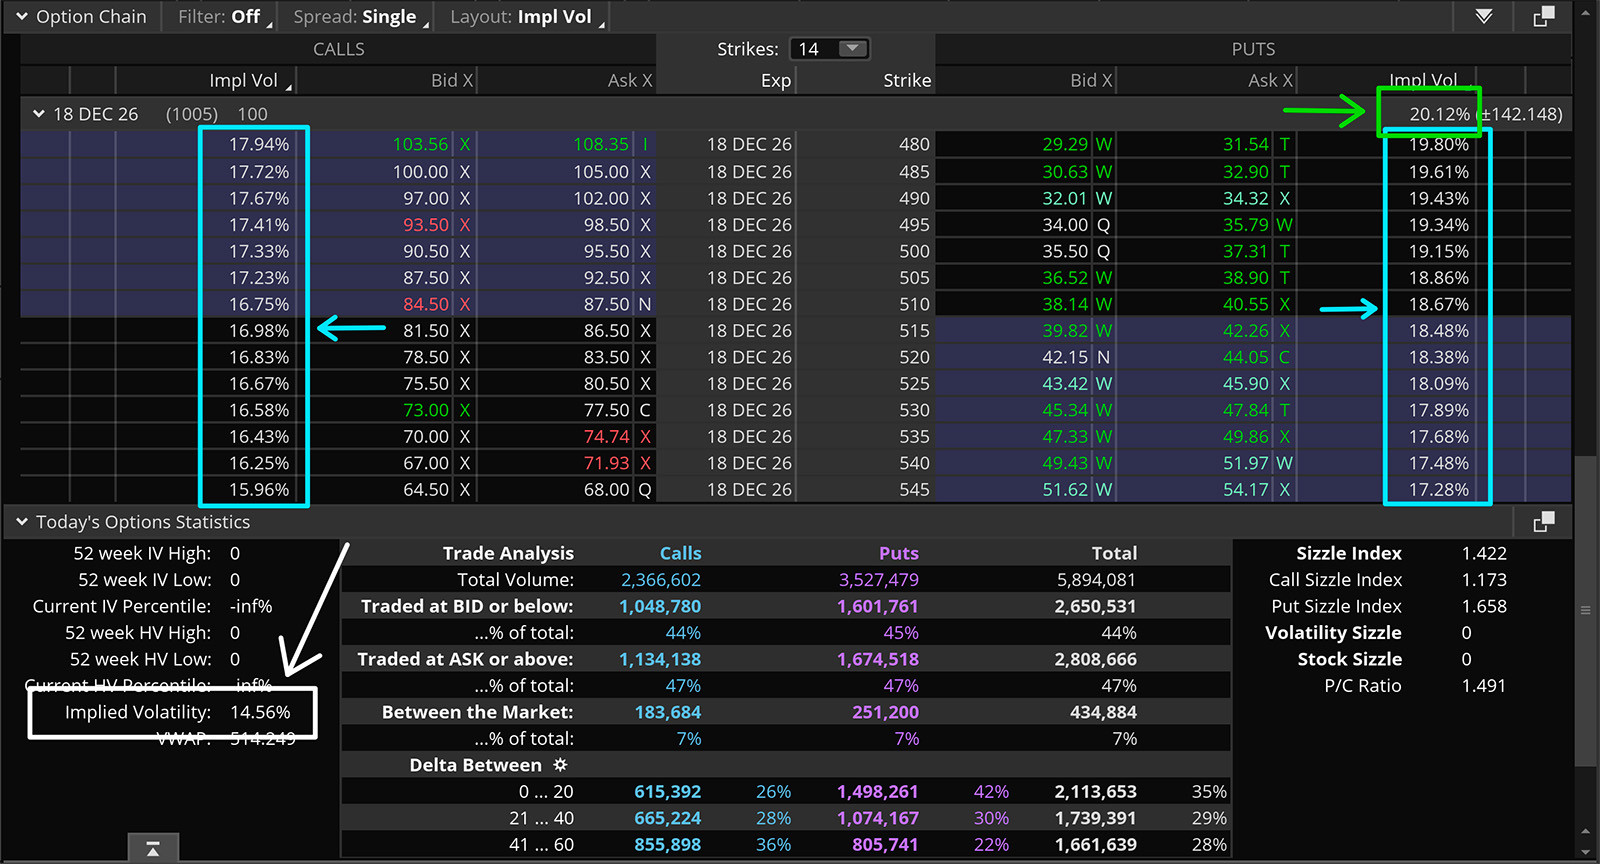
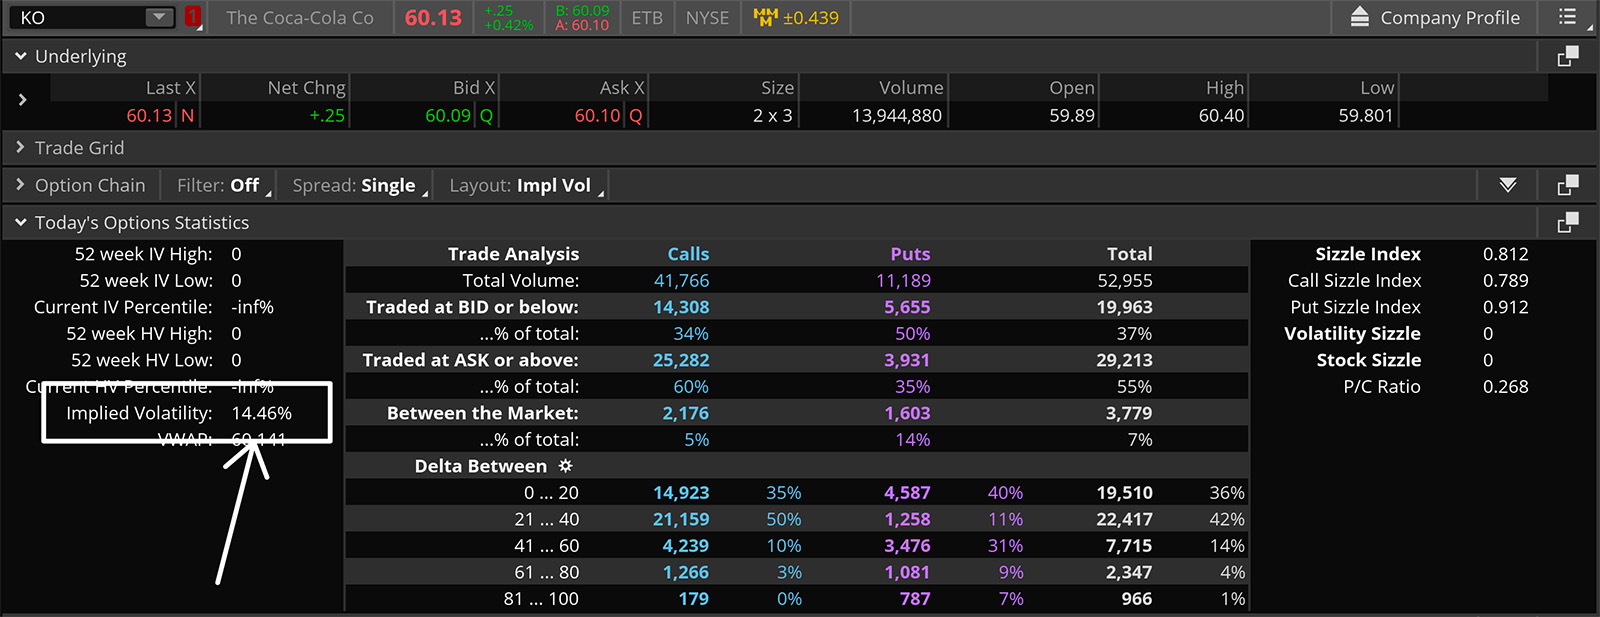
In Think or Swim, there are three places to view implied volatility. In white we have the overall implied volatility for the underlying asset. In green we have the implied volatility for a specific option’s expiration. In blue we have the individual implied volatility of a specific options contract.

Implied Volatility Rank (IVR)
Implied Volatility Rank (IVR) is a study that compares the current implied volatility of an asset to its historical range of implied volatility over a specified look back period. It’s shown as a percentage, with higher values showing current implied volatility is relatively high compared to past levels, and lower values showing that implied volatility is relatively low. IVR helps us understand current implied volatility levels to determine if options are priced relatively cheaply or expensively compared to the past.
It’s incredibly important to understand that implied volatility rank is not the implied volatility of the underlying asset. So if you see 80% on the implied volatility rank, the actual implied volatility is likely not 80%. It could be, but they are not the same metrics. The 80% IVR just suggests that the implied volatility is higher now than 80% of the time in the look back period.
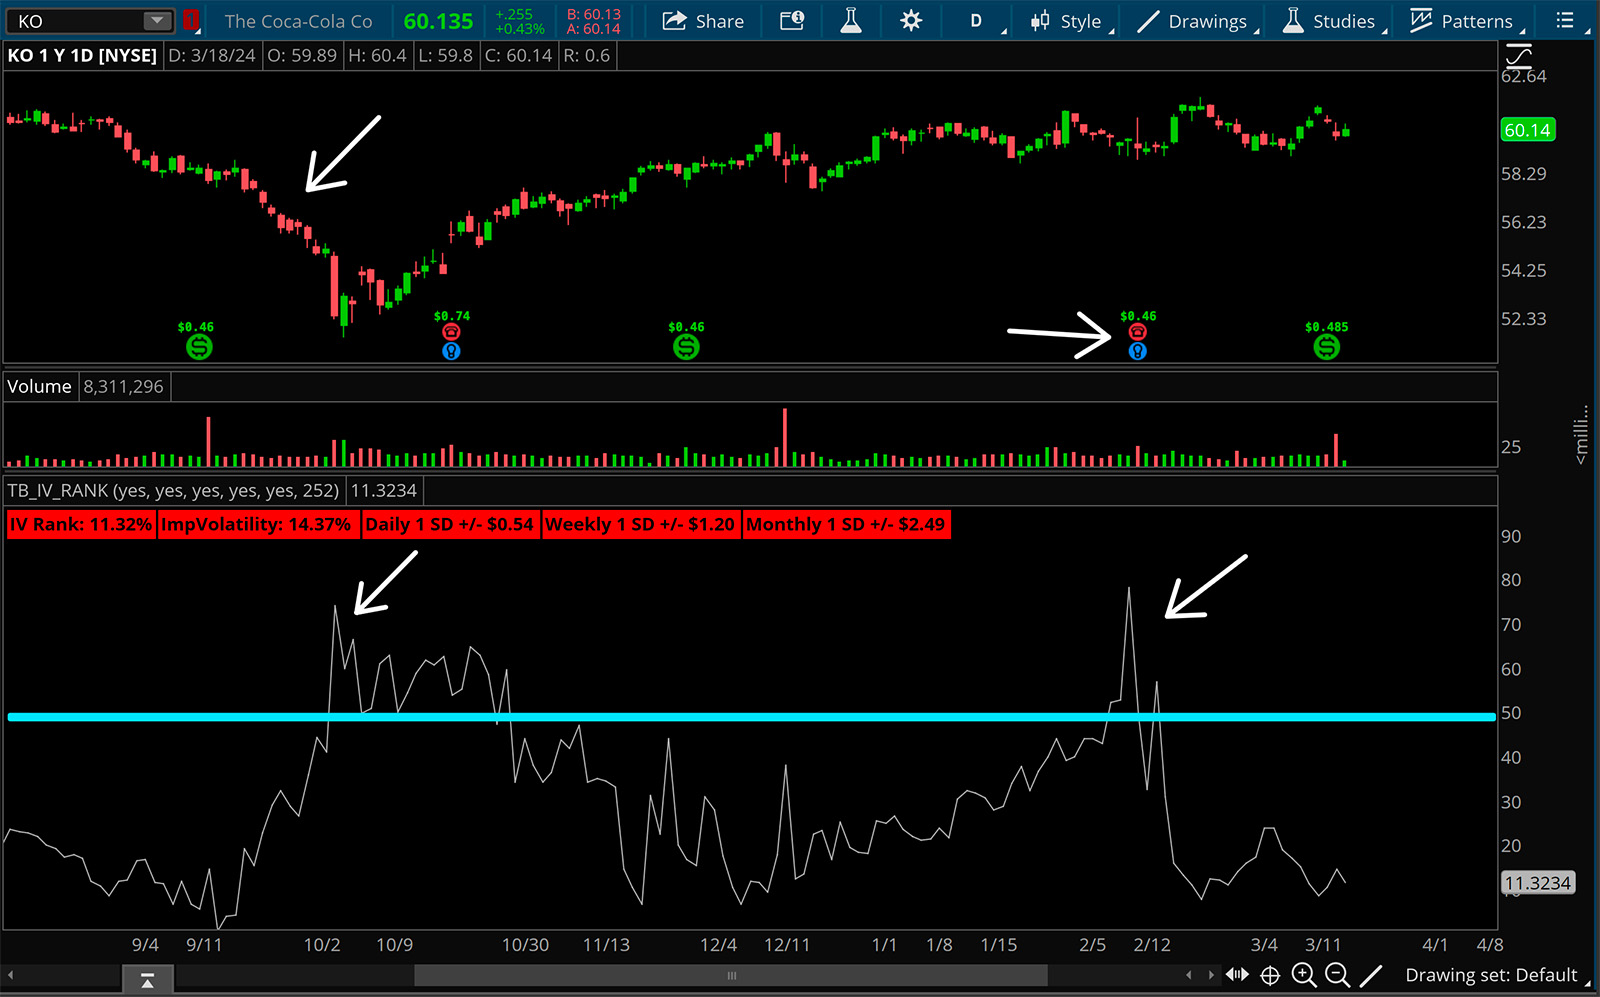
A classic example of this is looking at a relatively low implied volatility product. Let’s take Warren Buffet’s darling Coca Cola (KO). The IV generally hovers between 15-25%. The IV rank might read at 100% if for some reason the IV of KO spiked to 30%. Meaning that the 30% read is higher than 100% of the reads during the look back period. KO or the option on KO are not expected to move 100%, rather the rank is on a relative basis extremely elevated compared to normal circumstances. In the image below, you can see the IVR spikes to roughly 80% during an aggressive sell off (uncertainty) or before the earnings announcement (uncertainty).


Using IV and IVR to Trade
Implied volatility is key in options trading strategies, as it shows us the potential for the option to move. High implied volatility levels imply greater uncertainty and potential for larger price swings, making options more expensive as traders pay a premium for the increased probability of significant moves. On the flip side, low implied volatility suggests lower expected volatility and cheaper options premiums.
Although every trade should have the basic components of a trade plan, in simple terms, options traders want to be net long premium when IVR is low and net short premium when IVR is high. The underlying asset price doesn’t have to move for options pricing to fluctuate. Assume a stable underlying price, and stable conditions on other options greeks. If implied volatility (not rank, although they would likely move in a correlated manner) drops, the options contract becomes less valuable on the assumption it has less of a capacity to move. If implied volatility rises, the options contract will become more valuable on the assumption it has more capacity to move.
A common phenomenon to avoid is getting net long options ahead of an earnings move when IVR is elevated. As soon as the earnings number comes out, oftentimes what happens is the IV and IVR drops, because the uncertainty no longer exists. You could theoretically get the direction correct on an earnings trade via options, but lose money if the implied volatility falls enough to offset the gain you made from the price action. So does that mean you should sell options around earnings? That can also be dangerous when you have potentially unlimited loss if not hedged properly.
Conclusion
Understanding the distinction between implied volatility (IV) and implied volatility rank (IVR) is key for options traders. While implied volatility represents the market’s expectation of future price movement for an asset, IVR provides insight into whether current implied volatility levels are relatively high or low compared to historical norms. By using these metrics effectively, you can better assess options pricing, to spot potential trading opportunities, and manage risk more efficiently.
