Understanding “R” in Trading
In trading, “R” is a standardized unit used to measure the risk and reward of trading strategies and individual trades. This method creates a standardized benchmark traders can compare strategies and trades with regardless of their risk tolerance or account size.
Key Terms and Definitions
1R
1R represents the ideal amount of risk a trader is willing to take on a single trade. It’s not how much money you have total in the trade, rather the distance from your entry to your stop, times the position size. Your 1R tolerance should be outlined in your trade plan and standard across all trades. For example, if you decide that your max risk per trade is $1,000, then your 1R is $1,000. 1R could also be an expression of a percentage of your account balance. Generally it should be 2% or less.
R-Multiple
The R-Multiple is the ratio of profit or loss to the amount risked. For example, if a trader risks $500 and makes $1500, the trade results in a 3R gain. Conversely, if they lose $1000 when only $500 was intended to be risked, the trade results in a -2R loss.
Intended R
Intended Rl is the planned risk and reward for a trade. For instance, if a trader plans a 3:1 reward-to-risk trade, they intend to risk 1R to gain 3R.
Realized R
Realized R is the real profit or loss after a trade closes. It reflects what actually happened, rather than what was planned.
Establishing Your “R” or Risk Amount
Determining your R involves choosing a consistent loss size that you are psychologically able to tolerate in respect to your account balance. You might be comfortable with a $1,000 loss, but if your account is only $10,000, that’s 10% per trade. Much too high. Conversely if you have a $2,000,000 account and are only risking $1,000 per trade, that’s .05%. You probably have wiggle room to size up so long as your trading strategy has positive expectancy. Sizing trades too small will never cause you to explicitly lose money, but your opportunity cost will be high.
If you want an R that is consistent and flexes with the size of your account, a percentage probably makes the most sense. If your account grows, your risk grows. This helps you navigate that opportunity cost from the prior example. If your account shrinks, so does your risk, allowing you to navigate drawdowns with a bit more finesse.
Generally your risk tolerance should be within 2% or less of your total account balance. This allows you to take 50 trades at minimum without blowing up your account. For example, if you decide to risk 2% of a $10,000 account per trade, your 1R is $200. The total value of your trade might be much higher, but the risk is confined to $200. If you lost 50 trades in a row your account would be cut in half. Much less effective than the full $10,000, but still in the game.
Many traders use a stop loss to manage their risk. Knowing your entry point and stop loss allows you to calculate the exact position size needed to maintain your chosen R.
Position size = R/|(Entry – Stop)|
Expressing Trading Profits as R or R-Multiples
Each trade’s risk and reward can be expressed in terms of R. For instance, if a trader sets a 3:1 reward-to-risk ratio and risks 1R, they will make 3R if the price hits their profit target. If 1R is 1% of their account, they will lose 1% if the trade fails but gain 3% if it succeeds. On a $10,000 account, this would be risking $100 to make $300. On a $1M account it would be risking $10,000 to make $30,000. Relative to the risk, each account made the same amount.
In the below example, you can see a rough 2.5:1 R trade setup. If a trader sized this with 1 share or 100,000 shares, the evaluation of the trade is consistent. One trader risked 5 points and made 13 points while another trader risked 500,000 points made 1,300,000 points. On a relative basis the two trades are the same. On an absolute basis, the larger sized trader made far more profit.
If you are looking at the running performance of multiple trades, not just a singular trade, you can add all of your Rs together. Say your week looked like this: Monday 3R, Tuesday 4.5R, Wednesday -2R, Thursday 2.75R, Friday -0.5R. Your weekly performance in terms of R would be 7.75R.
Let’s also say that that week you used all the same strategy on each trade. If you are trying to express the R multiple of the strategy, you would average the R’s per trade. Not just per day. Say Monday was 1 trade, Tuesday was 2 trades, Wednesday was 2 trades, Thursday was 2 trades, and Friday was 1 trade. The R multiple of that strategy would be .96R. This means that your win rate with the strategy would have to be over 50% to make it profitable in the long run.
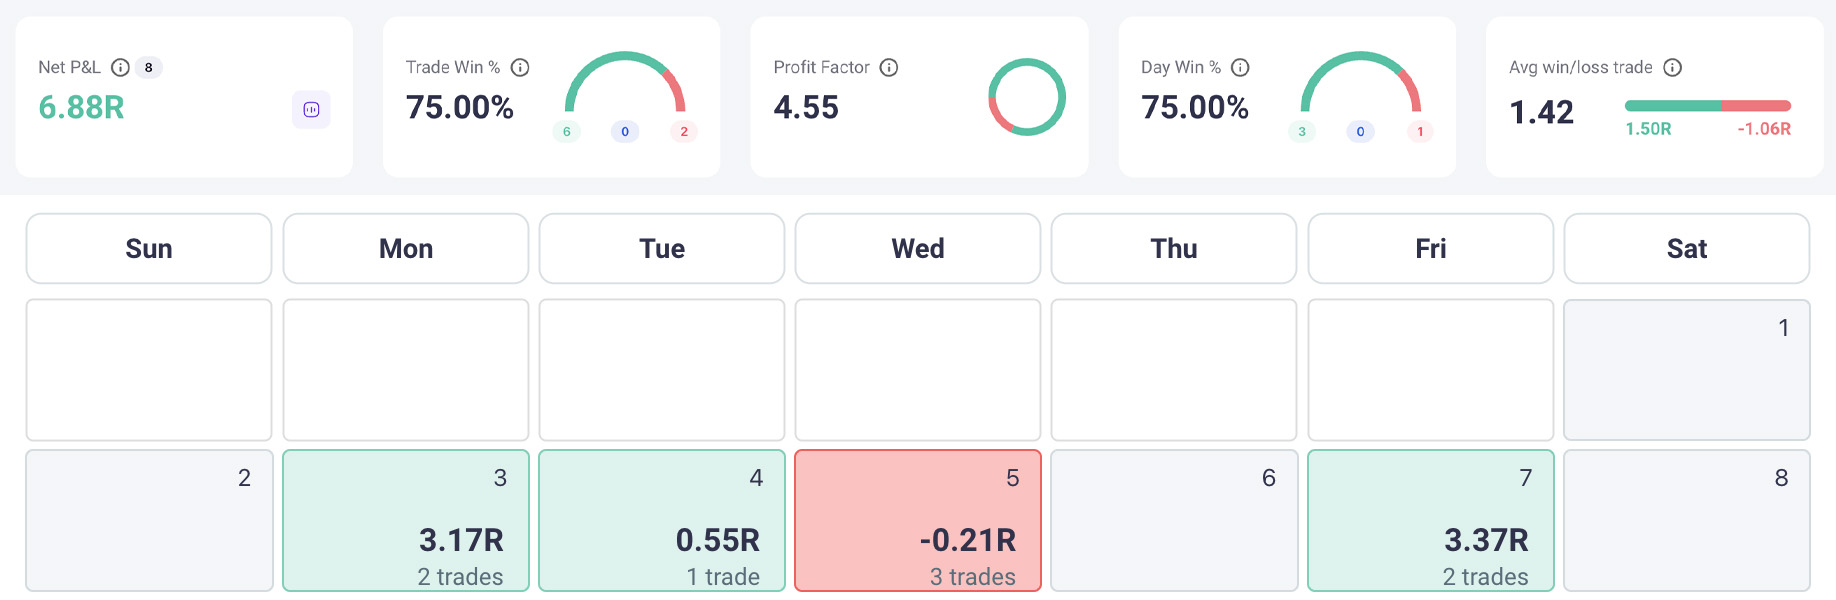
In the dashboard below, the performance for the first week of June can be found by totaling the R. Net performance is 6.88R. If we think about the average R multiple, we get 1.42R. To figure out expectancy we think about 5 winning trades and 3 losing trades. Our win rate is 60% which checks out with an average R multiple of 1.42. (in the image the win rate is the days win rate not the weeks)
Differences Between Intended R and Realized R
It’s important to stick to your planned targets. If your theoretical reward-to-risk ratio is 3:1, but your actual gains are only 1.5R, there might be issues like exiting trades too early or having unrealistic profit targets. The discrepancy between calling yourself a 3:1 trader if in reality your execution is more so a 1.5:1 is half. This means that your win rate needs to be dramatically higher than what you had originally planned for.
For example, if your average actual loss is -1.3R instead of -1R, your reward-to-risk ratio will be lower than expected. Even if you average 3R on winning trades, your actual reward-to-risk is 3R / 1.3R = 2.3:1, not 3:1.
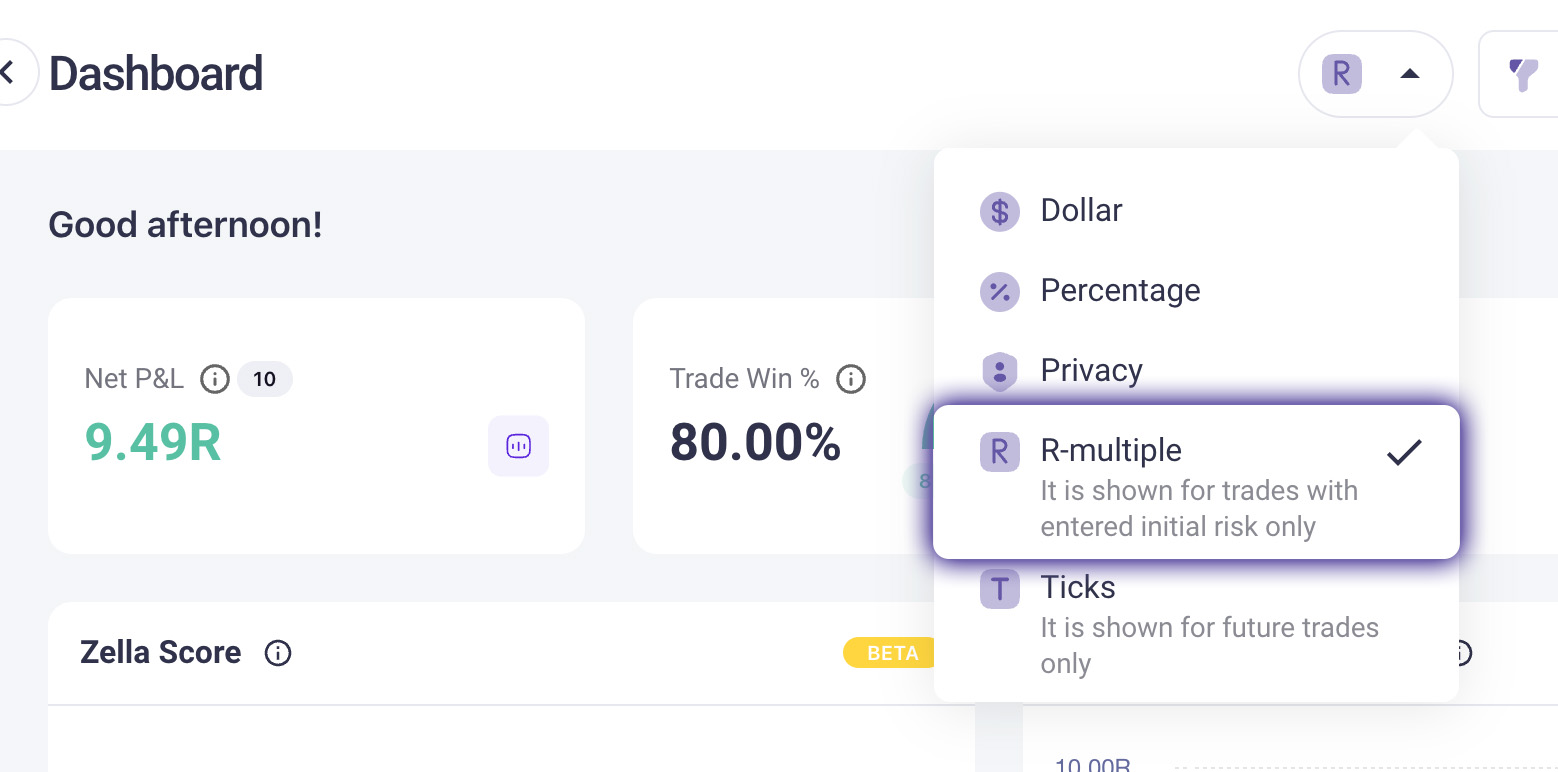
Tracking these metrics in your trade journal are critical to make the necessary improvements required to have positive expectancy. Tools like TradeZella have features like this baked in directly to their tool.
Examples of R with Charts
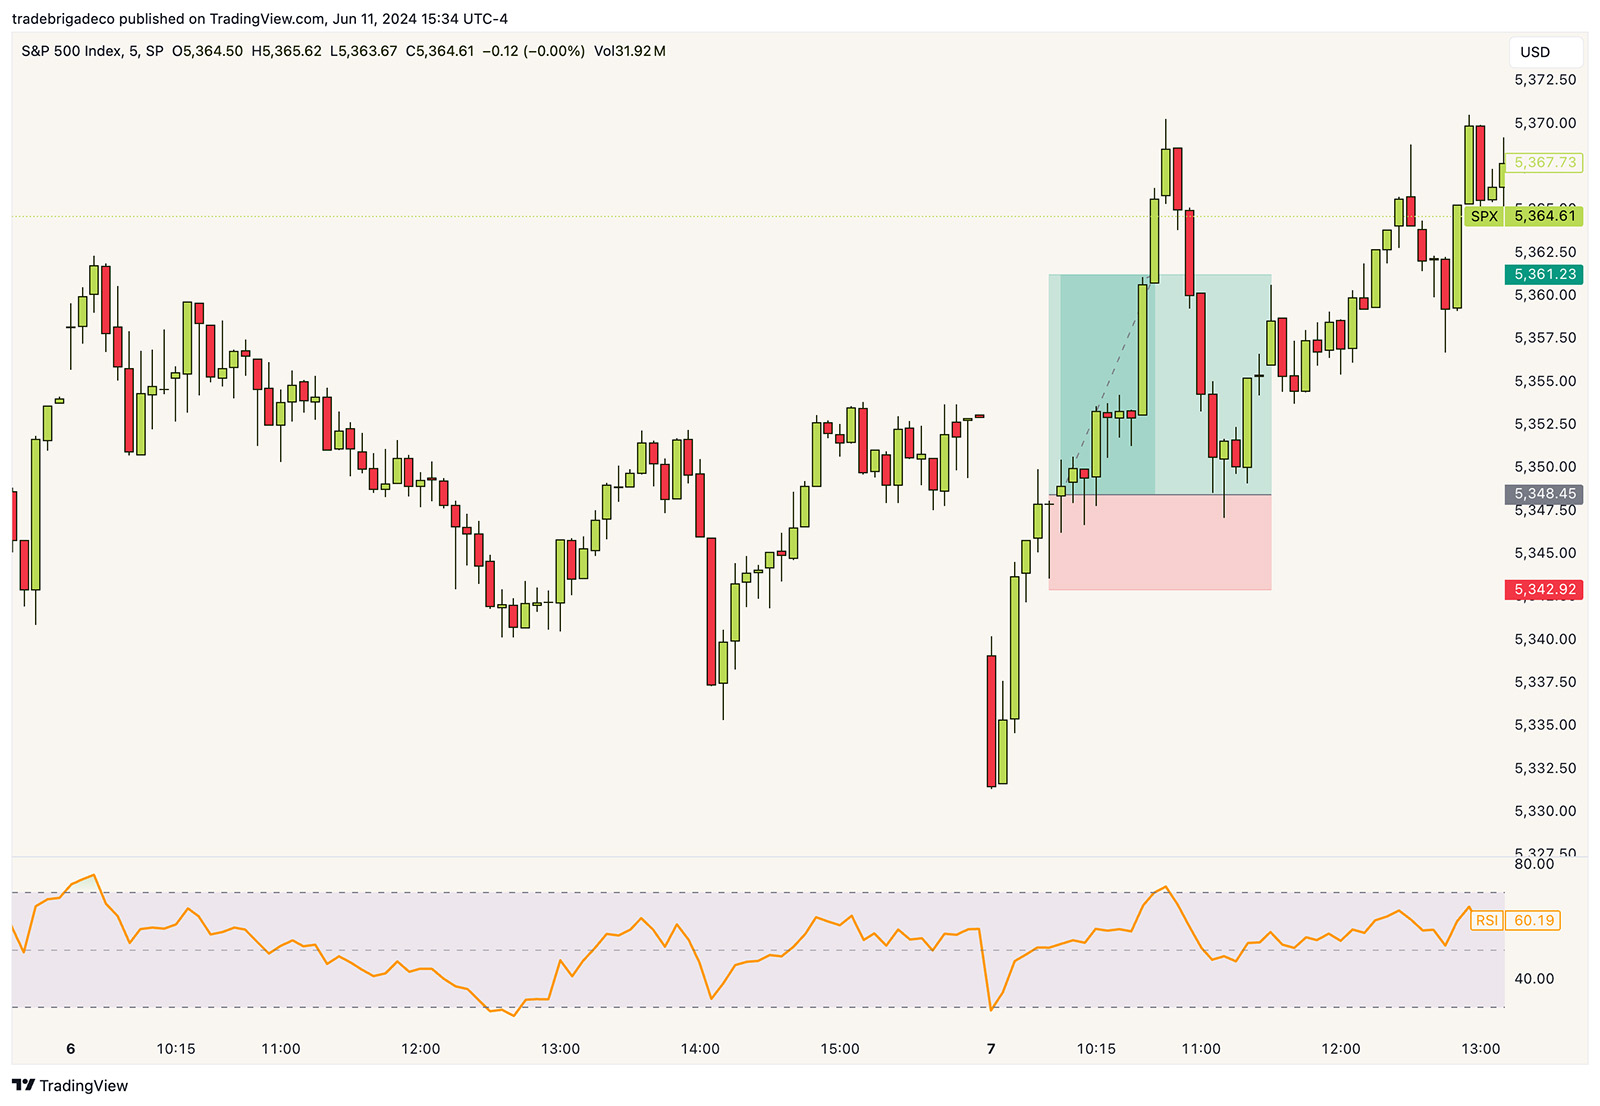
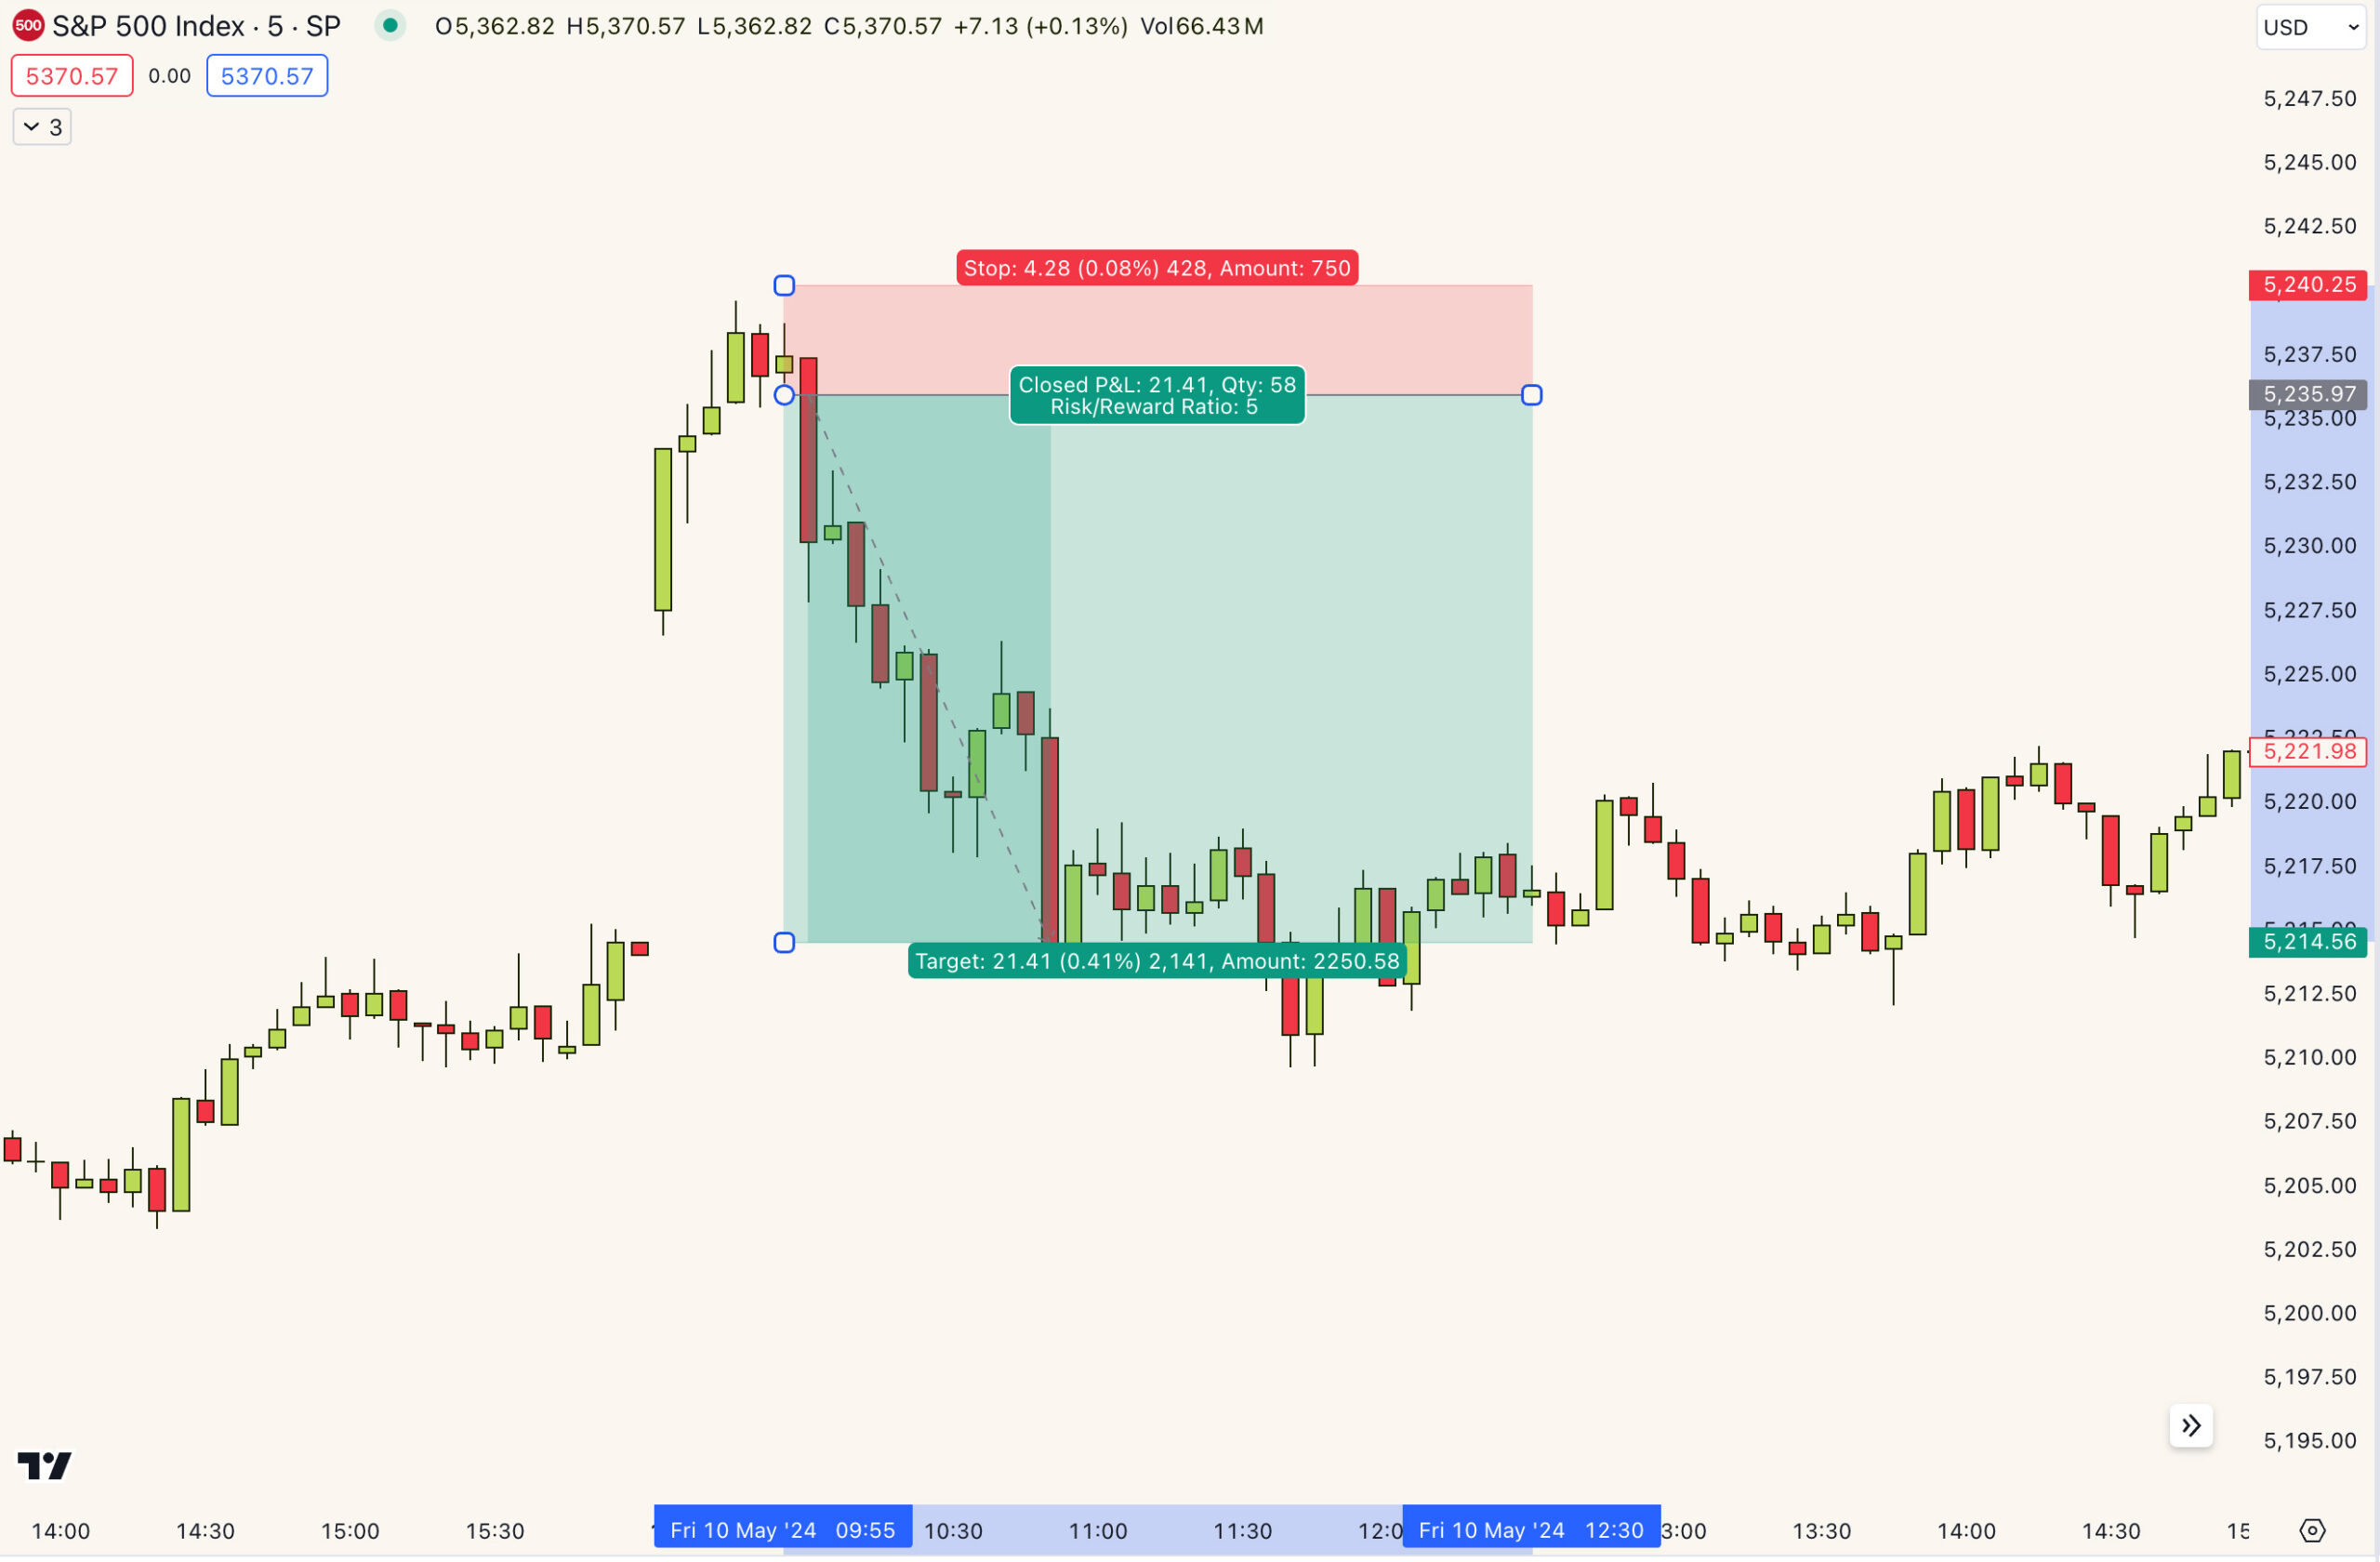
In the below example we have a 5:1 R trade on a gap close in the S&P. Generally 5:1 R trades are worth taking whenever they are available. Chart structure always dictates what the stop and target should be so we can’t make these trades up, but when the stars align, it’s worth taking. You can take 5 of these setups, lose every single time, and win the next time and be right to break even minus fees. Improve the win rate a bit, and suddenly you lose 3 and win 3 (“only” a 50% win rate) and you’re technically up 12R.
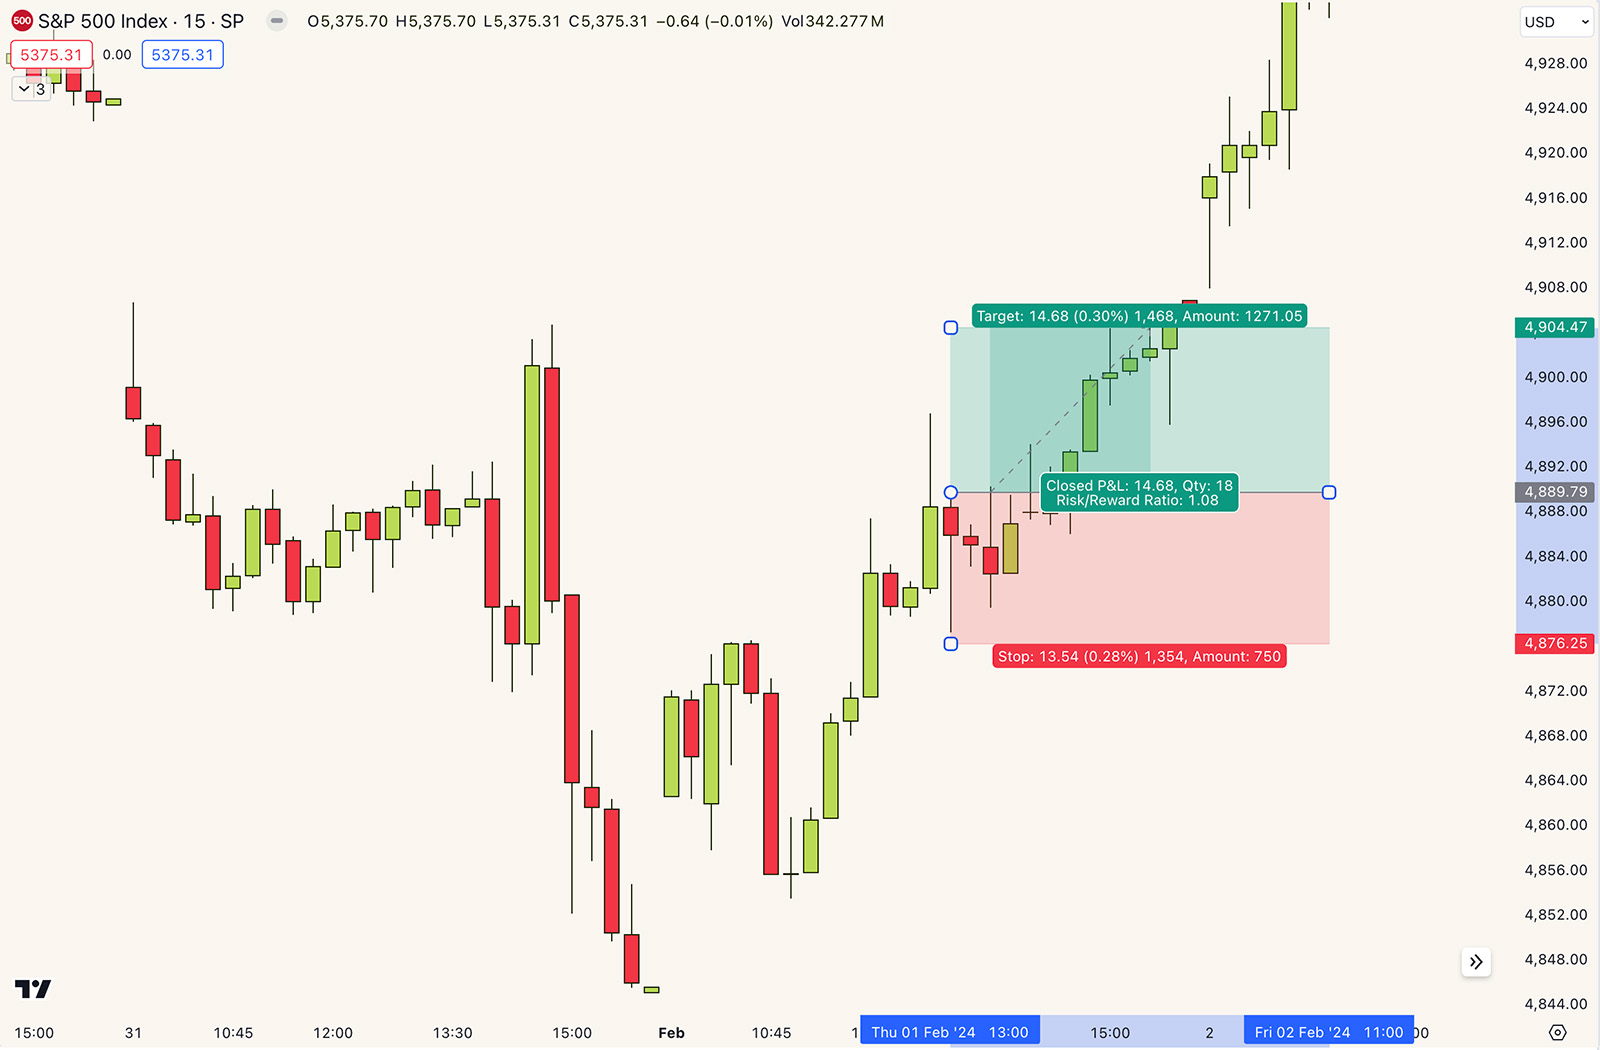
In this next example, we can see the 15 minute trend is trying to remain in the upward direction with a hammer higher low pullback. If you were to target the prior day high with a stop under the last higher low, the trade is a 1.08:1 R trade. These types of trades are typically not worth taking as you need to win over 55% of your trades consistently to have positive expectancy. If you lose one and win one, you’ve captured 0.08 R. Pretty tough to make a consistent income or grow an account with that type of metric.
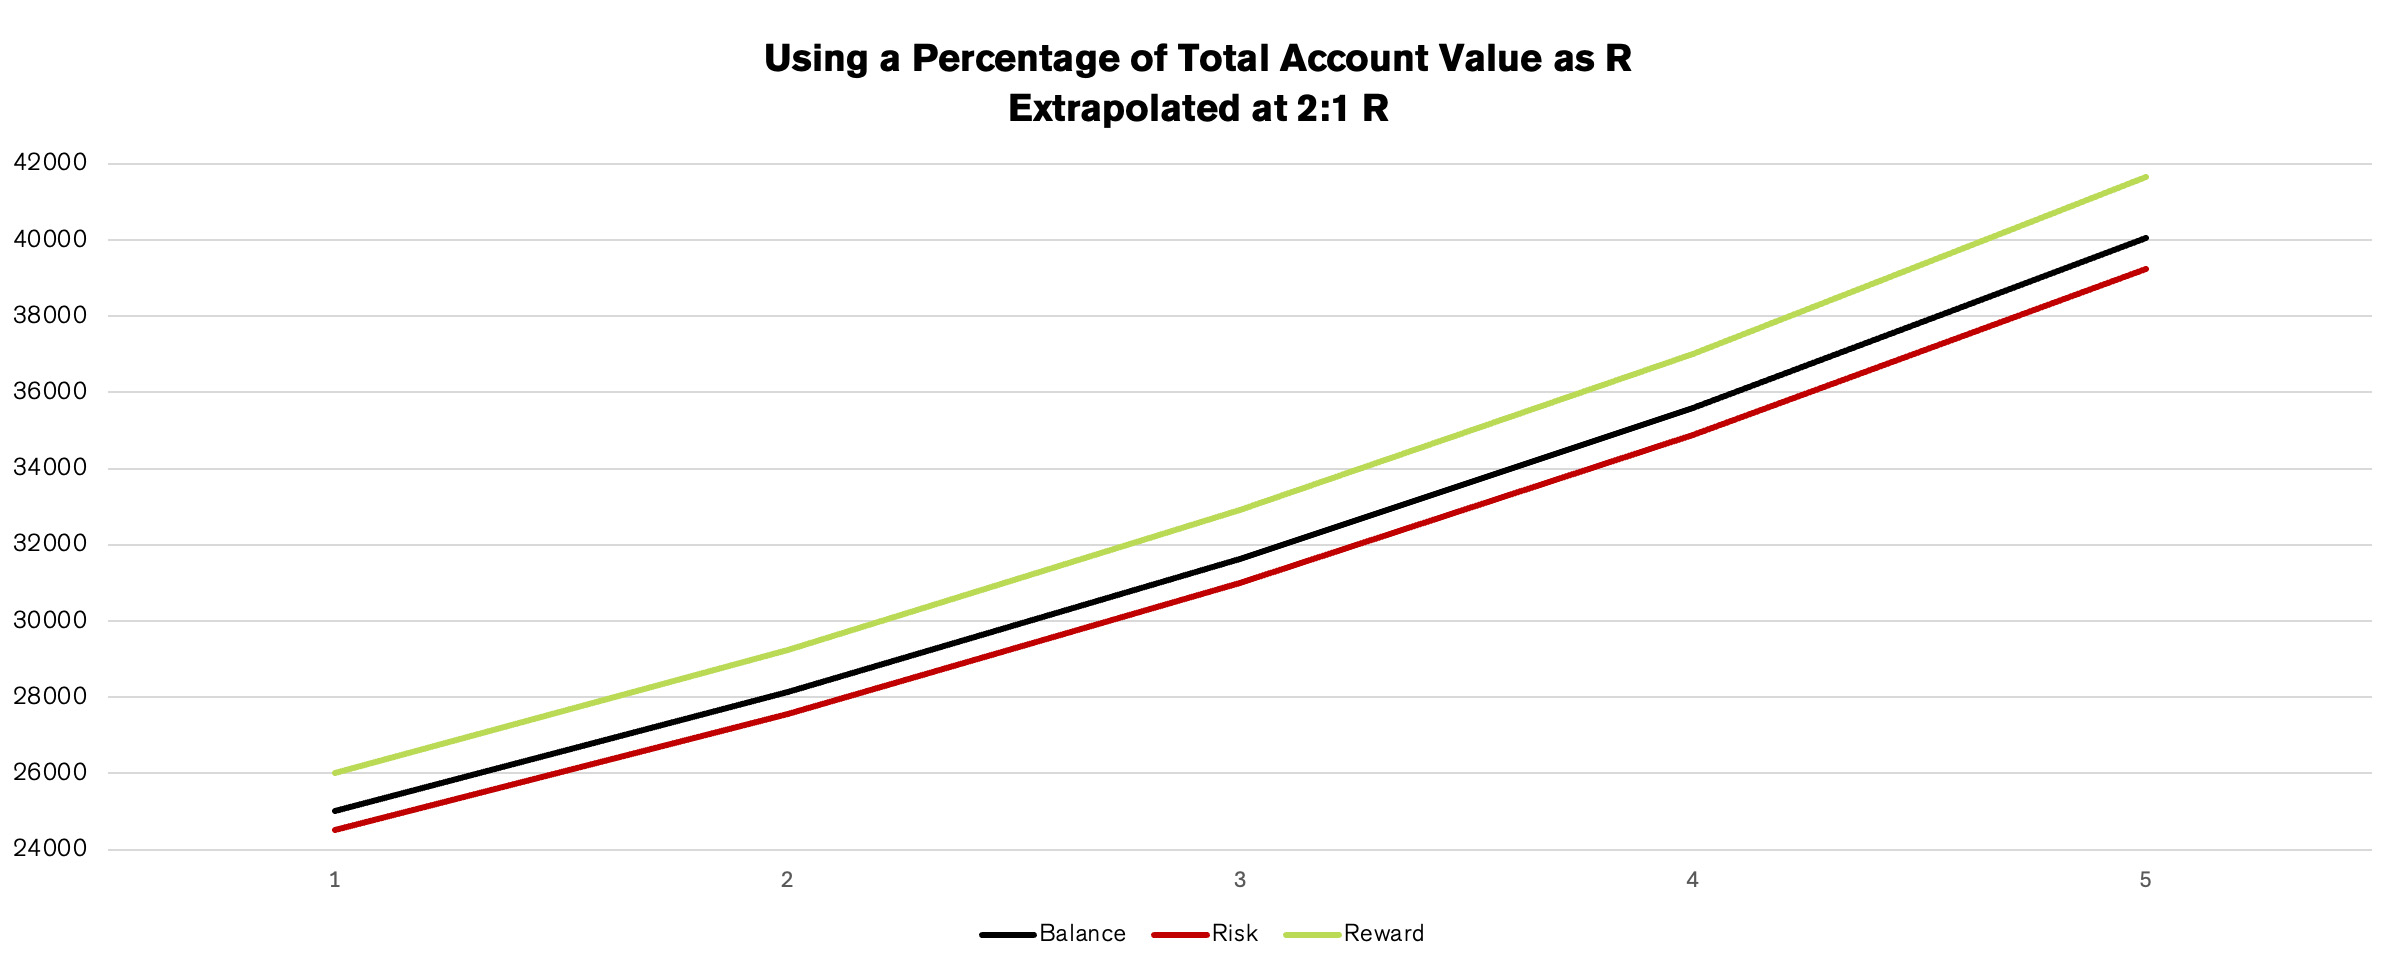
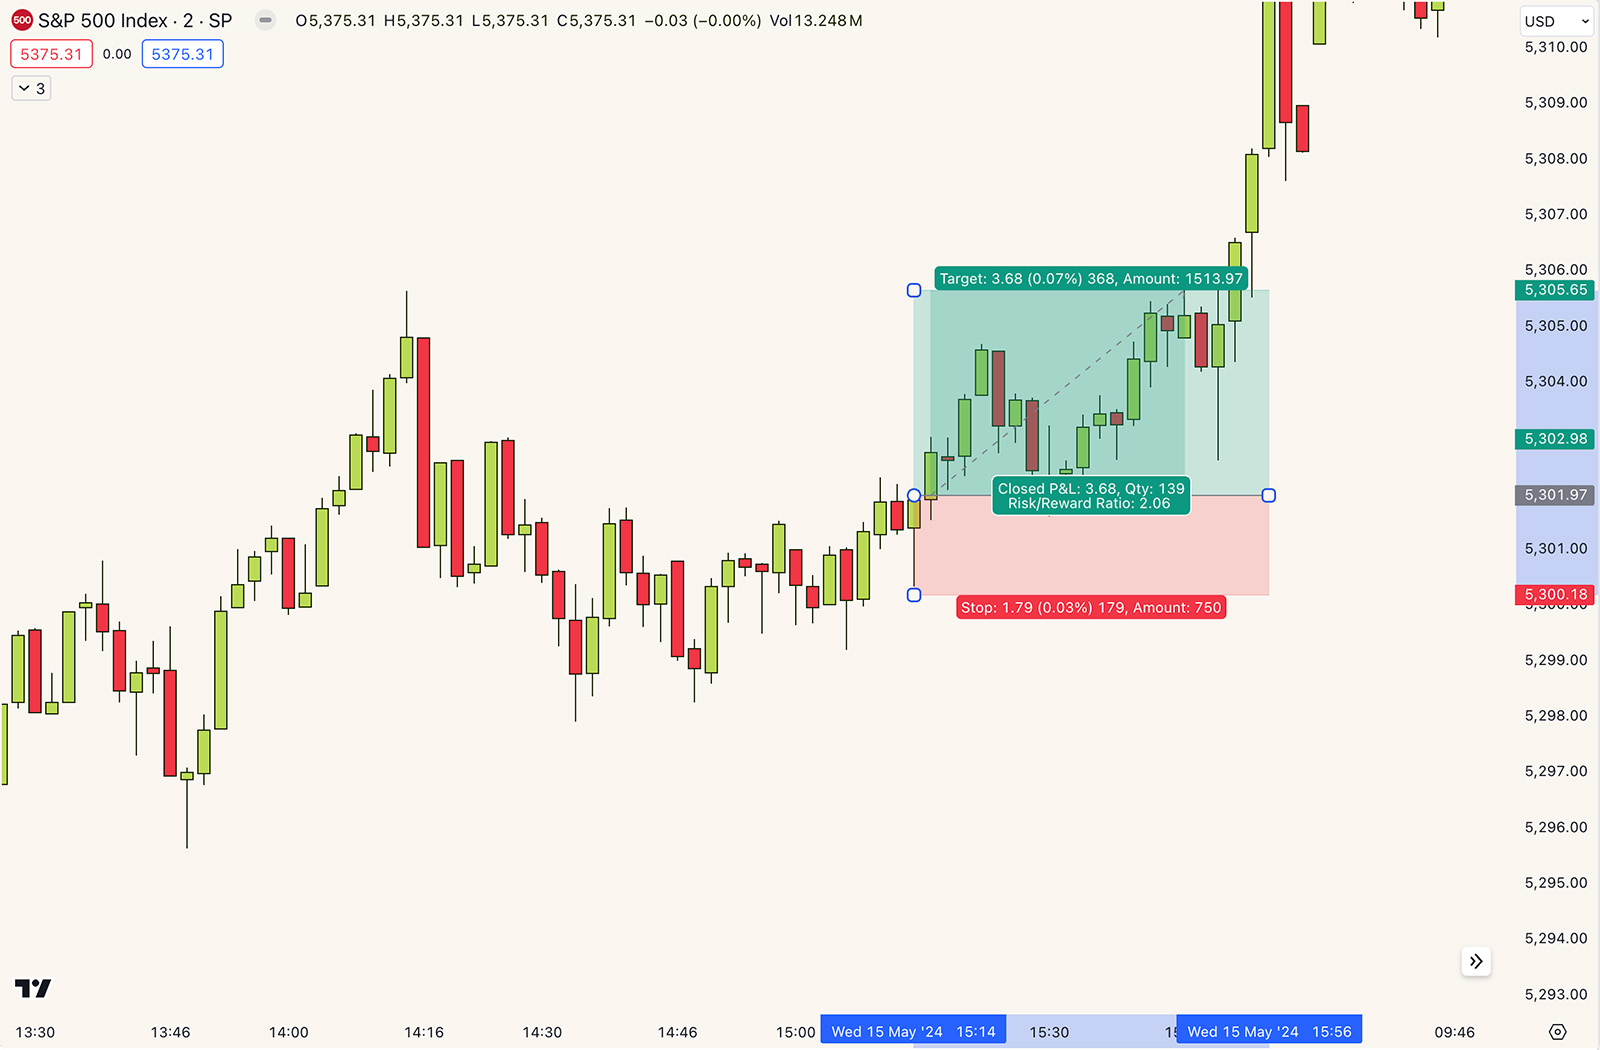
The next example is the sweet spot. 2:1 R trades are more common than 5:1 R trades, and we can still lose 2 trades, win 1 and be break even. If your win rate is over 40% you’ll have positive expectancy.
Why Express Trades in Terms of R?
Comparison Across Account Sizes: Traders with different account sizes and risk tolerances can compare strategies and results effectively.
Revealing Mistakes: Using R highlights errors in position sizing and risk management.
Understanding Reward:Risk: Knowing your R values helps you quickly assess your reward-to-risk ratio.
Conclusion
Using R in trading standardizes risk management, making it easier to track performance, identify mistakes, and compare strategies. By defining and sticking to a consistent R, you’ll improve your overall trading results and hopefully end up with more profit!