How to Backtest Your Trading Strategies with TradeZella
Backtesting is a must for traders looking to refine their strategies and improve their performance without risking real capital. TradeZella offers a full backtesting platform, allowing you to simulate trades using historical data.
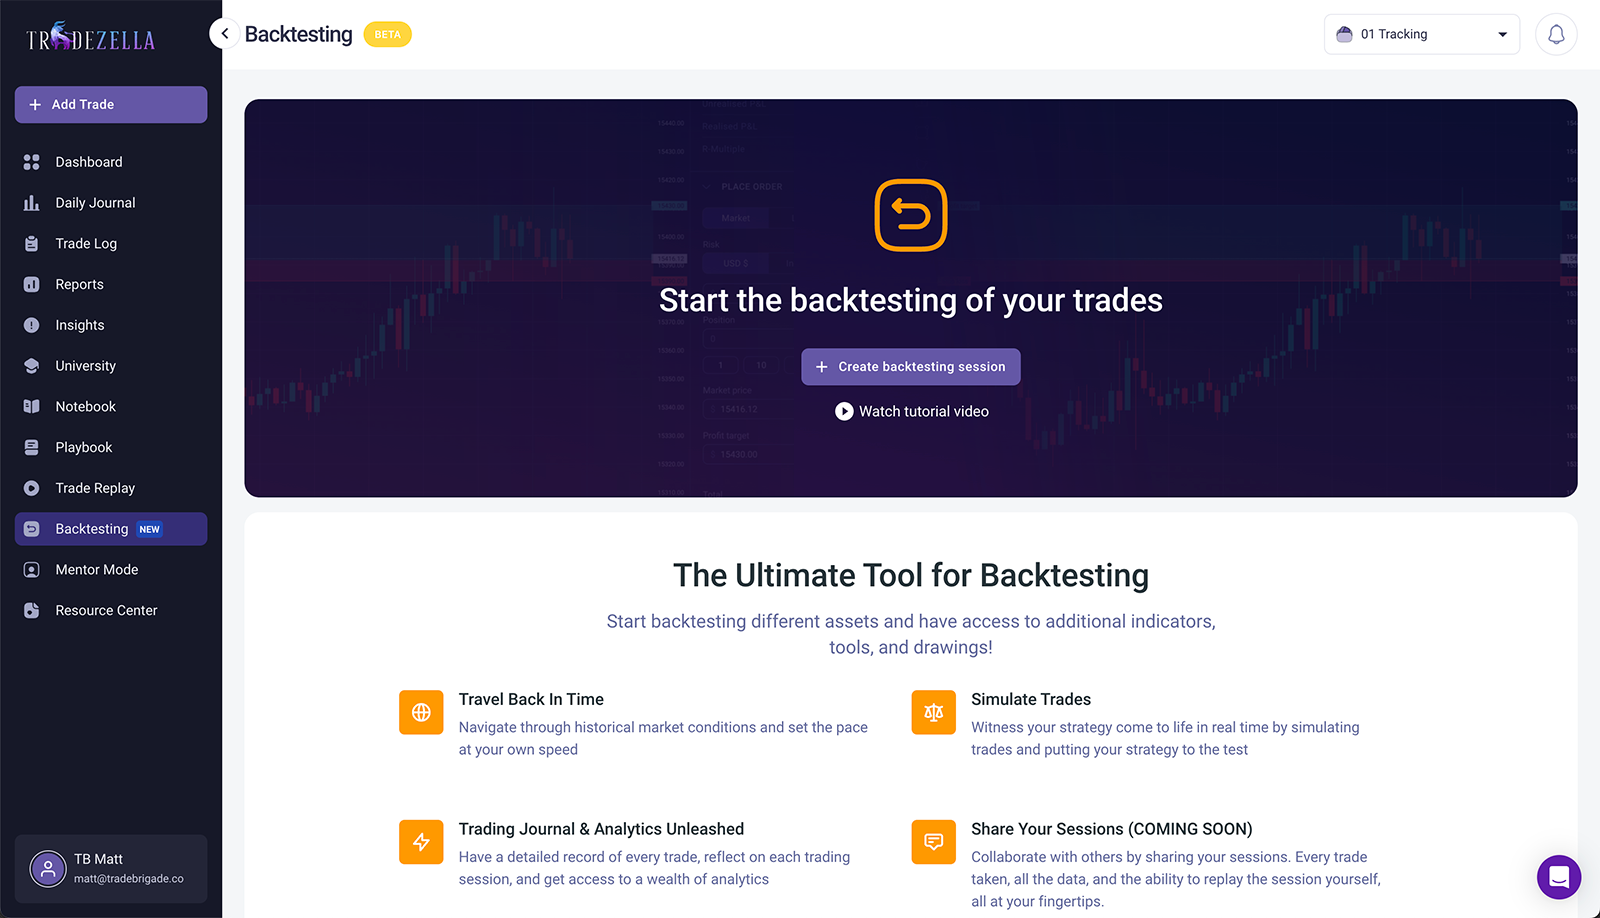
Getting Started with Backtesting
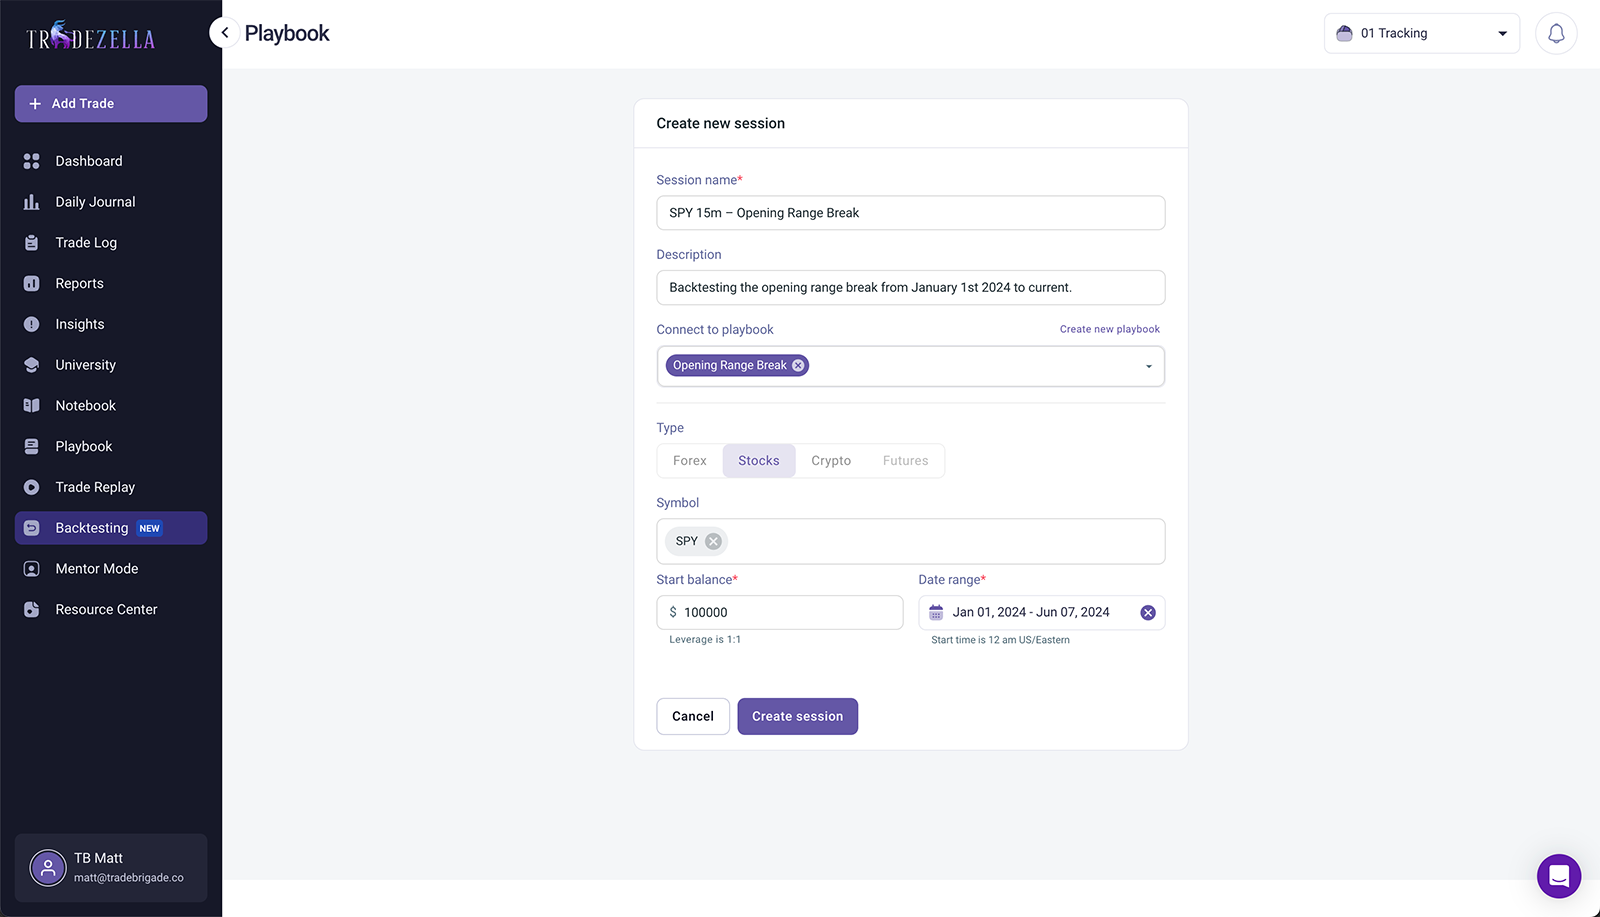
To start a backtesting session in TradeZella you’ll want to click on the left hand side bar to reveal your options. Select ‘Backtesting’ and create a session. You have to give the session a name and the best approach is to call it by the strategy or symbol that you are backtesting on. For example, if you are backtesting the opening range breakout on a 15 minute chart on the S&P 500 index you might name the session “SPY 15m – Opening Range Break.” Something descriptive will allow you to reference it in the future and see the results more efficiently.
Once you’ve generated a TradeZella backtesting session, you should connect the relevant playbook to it. This should be related to the strategy that you are trying to test. If you don’t have one, you can create one by clicking on “Create new playbook.” For the example we’ve been using so far, you should select or create a playbook for “Opening Range Break.”
Backtest with Realistic Expectations
Next, select the instrument you want to backtest on, your account simulated balance, as well as the date you want to go back to. It’s critical at this point you have a realistic approach to backtesting and start the account balance with what you would actually use in a real account. Using unrealistic balances and position sizes in backtesting is just cheating yourself out of the entire exercise. If you can’t replicate it in real terms, you’re quite literally just playing around in a fantasy land.
Placing and Managing Trades
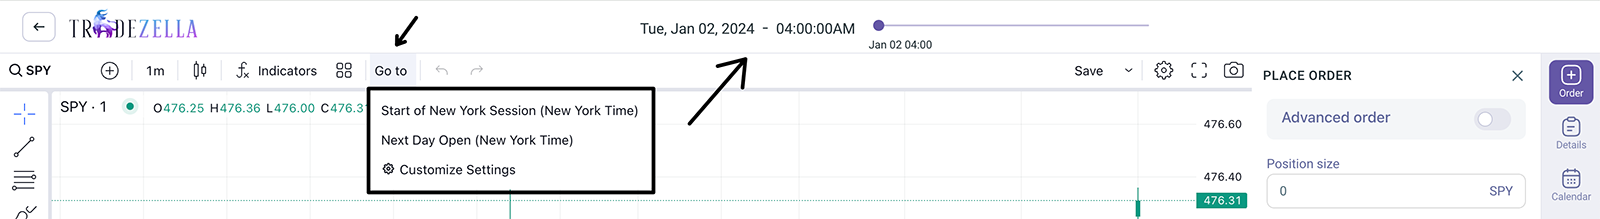
Once the session is created, you can customize your screen experience to display what you would typically use in a real session. The chart provider for TradeZella is TradingView, and all of the tools work there as they work in the native app. Adjust the time frame chart to your preference and use the date and time function at the top to go to the desired starting period. A really convenient setting is the Go To session start. You can customize this to any desired time you’d like.
Now you’re ready to start placing orders and seeing how your strategy performs. On the right hand side you have an order entry pane where you can set your risk percentage, either for the account current or starting balance. This is a great feature that keeps risk consistent so your results are accurate. If you size different trades arbitrarily, you’ll never really know how well your strategy performs in terms of net P/L. R multiple would be the only metric that helps you understand.
Like a normal order entry tool, you can enter and exit trades using a market, limit, or stop order. You can set stops and take profits as well. A really cool feature is that the backtesting software will understand your orders if you use the long or short position tool in TradingView. From there you can drag your orders on the chart to adjust them to the desired price.
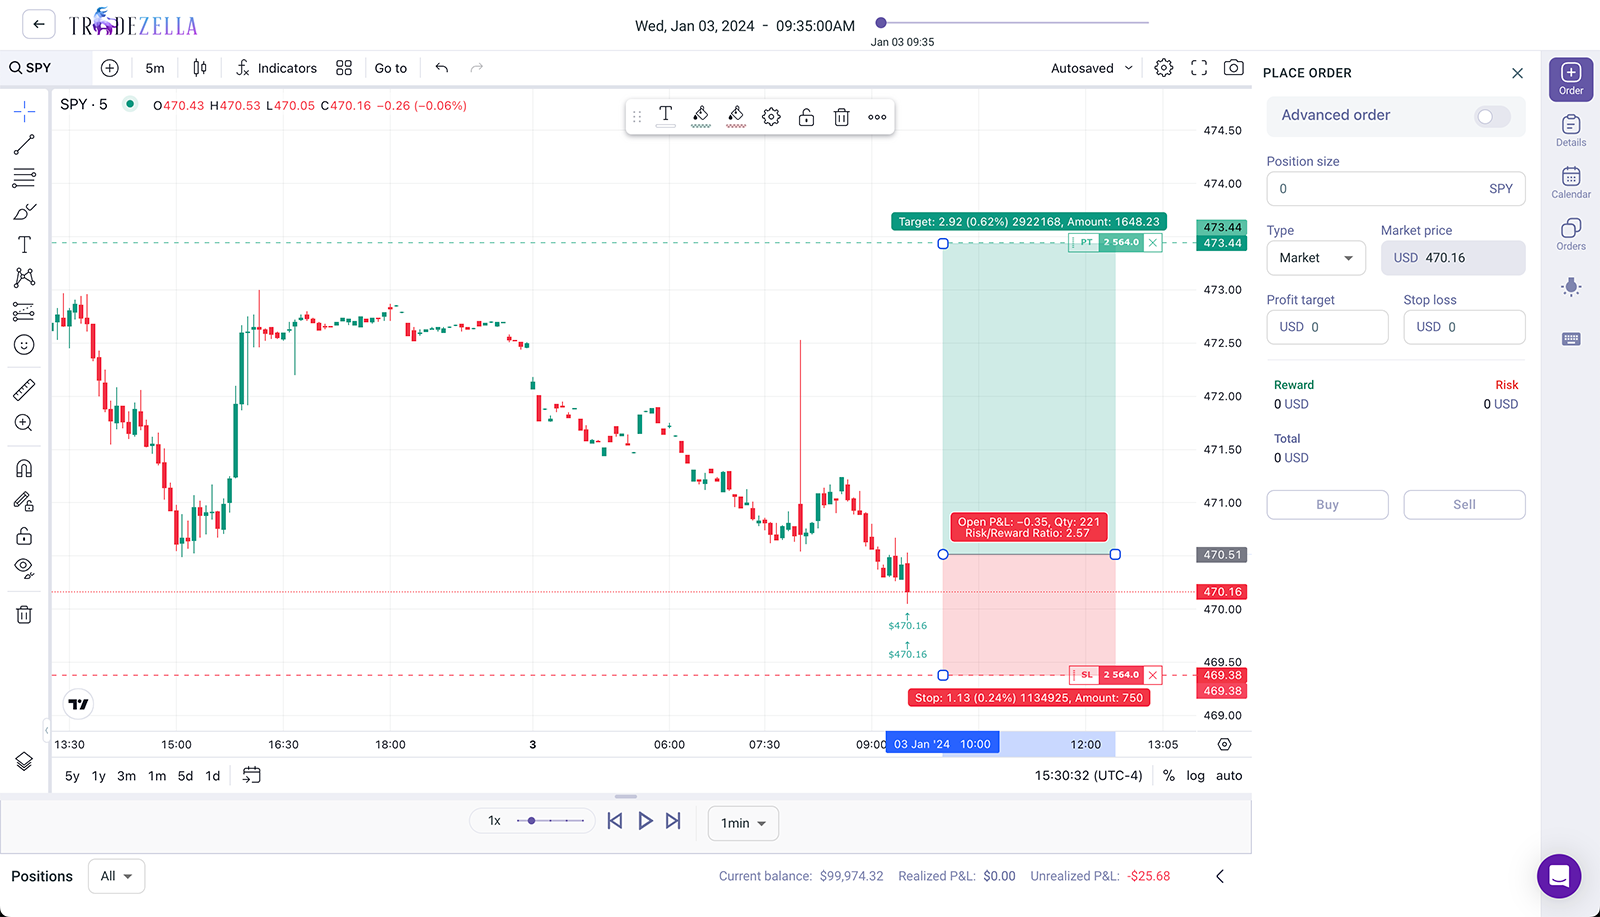
Once your orders are in the market, you can play the simulation and see how the trade would have performed at an accelerated pace. You can use the speed function to go faster or slower. Once trades are complete, you can review the simulated performance with all of the normal tools that TradeZella offers.
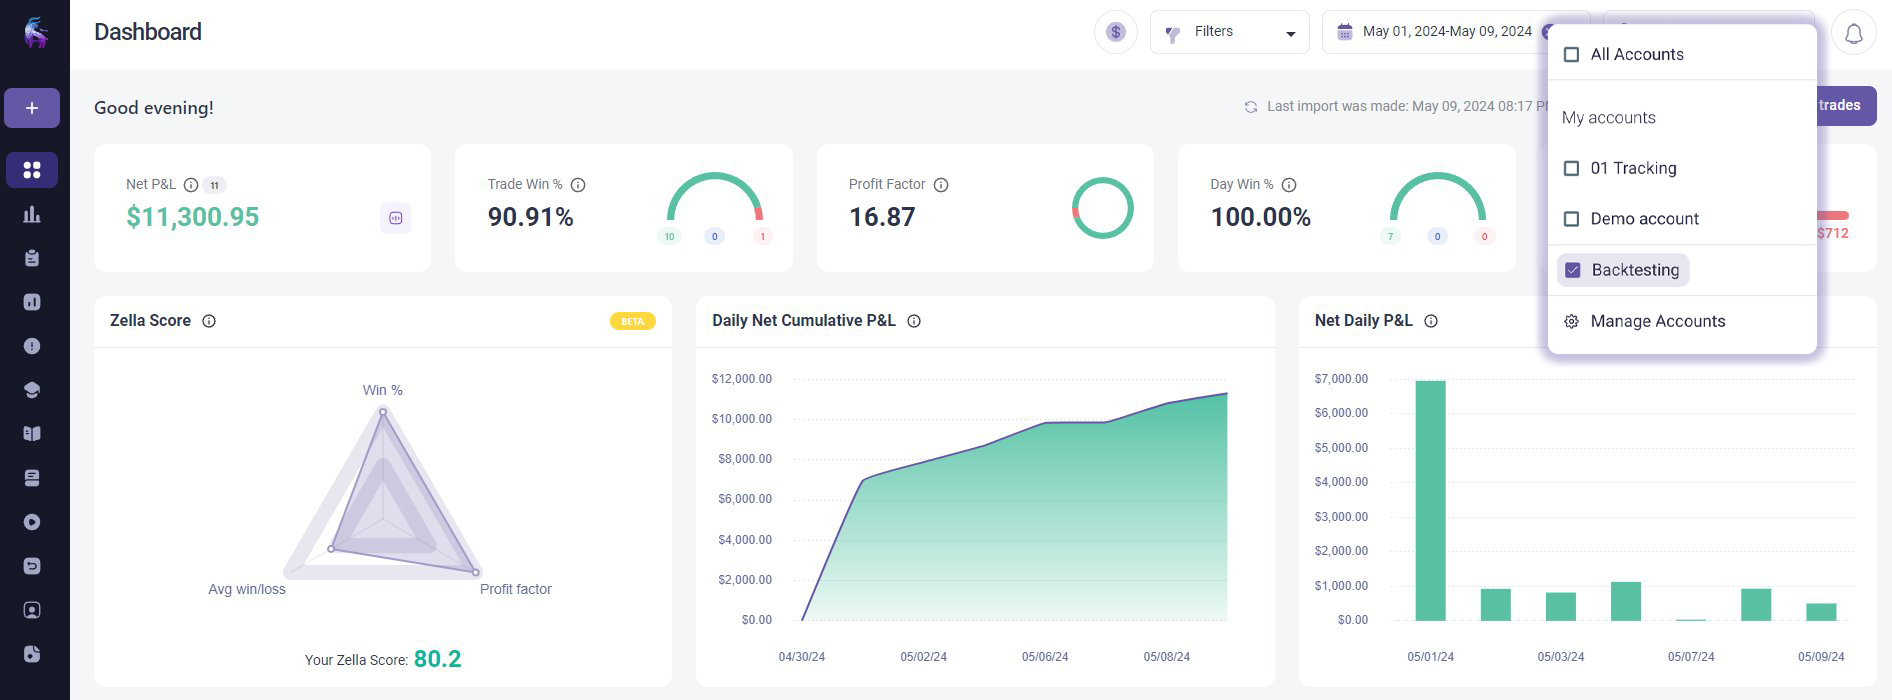
Analyzing Session Performance
To view your session stats, you can set your TradeZella dashboard to that backtesting session and view metrics such as win percentage, realized profit and loss (P/L), and most importantly the trade strategy’s expectancy. This is how you’ll know whether or not the strategy is worth pursuing with real money. To find even more detail about the strategies performance like average win/loss, average hold time, drawdowns and run ups, use the platforms drill down feature by double clicking into stats.
From here its time to evaluate what needs improvement or what can stay the same. If you notice that the strategy has really large drawdown periods, is there something that can help you avoid that? Are those times where you’re technically trading against a higher time frame trend? What happens if you add a rule to your playbook that says the strategy can only be executed if the opening range break is in the direction of the 1 hour trend? Less drawdown? Higher win rate?
All of these questions and adjustments are worth pursuing if you have the bones of a strategy that is going to be worth using with real money. You can continue to test the updated thesis on the same backtesting session, or you can create a brand new one. The beauty is that TradeZella allows you to have an unlimited number of sessions.
Conclusion
TradeZella offers users all of the tools required to evaluate their trading data. Backtesting is just a component of building a profitable strategy, and all the tools are at your fingertips in TradeZella. You’ve got one of the most robust journaling platforms to analyze performance, and a built-in backtesting feature. Talk about a seamless integration. Start backtesting today with a Trade Brigade discount:
Save 20% on TradeZella
TradeZella allows you to harness your trading data and gain actionable insights to becoming a profitable trader. Use code "TB" at checkout.