QQQ vs. XLK: Which Tech ETF is Better?
The two biggest technology focused ETFs are the QQQ and XLK. Both ETFs offer exposure to the tech sector, but they have different compositions and investment strategies. Let’s compare QQQ and XLK, covering their structures, performance, fees, and try to determine which ETF is a better choice for you.
Understanding QQQ and XLK
QQQ, also known as the Invesco QQQ Trust, tracks the Nasdaq-100 Index. This index includes the 100 largest non-financial companies listed on the Nasdaq stock exchange. It is heavily weighted toward technology stocks, but it also includes companies from other sectors such as consumer discretionary and healthcare.
XLK, or the Technology Select Sector SPDR Fund, focuses specifically on the technology sector companies from the S&P 500 Index. This means XLK is limited to tech companies only with no exposure to consumer discretionary or healthcare.
Composition and Holdings
While both ETFs are tech-heavy, their specific compositions differ. QQQ includes a broader range of companies due to its tracking of the Nasdaq-100, which includes non-tech sectors as well. In contrast, XLK is more concentrated on pure technology firms from the S&P 500.
For example, as of the latest data, QQQ’s top holdings include:
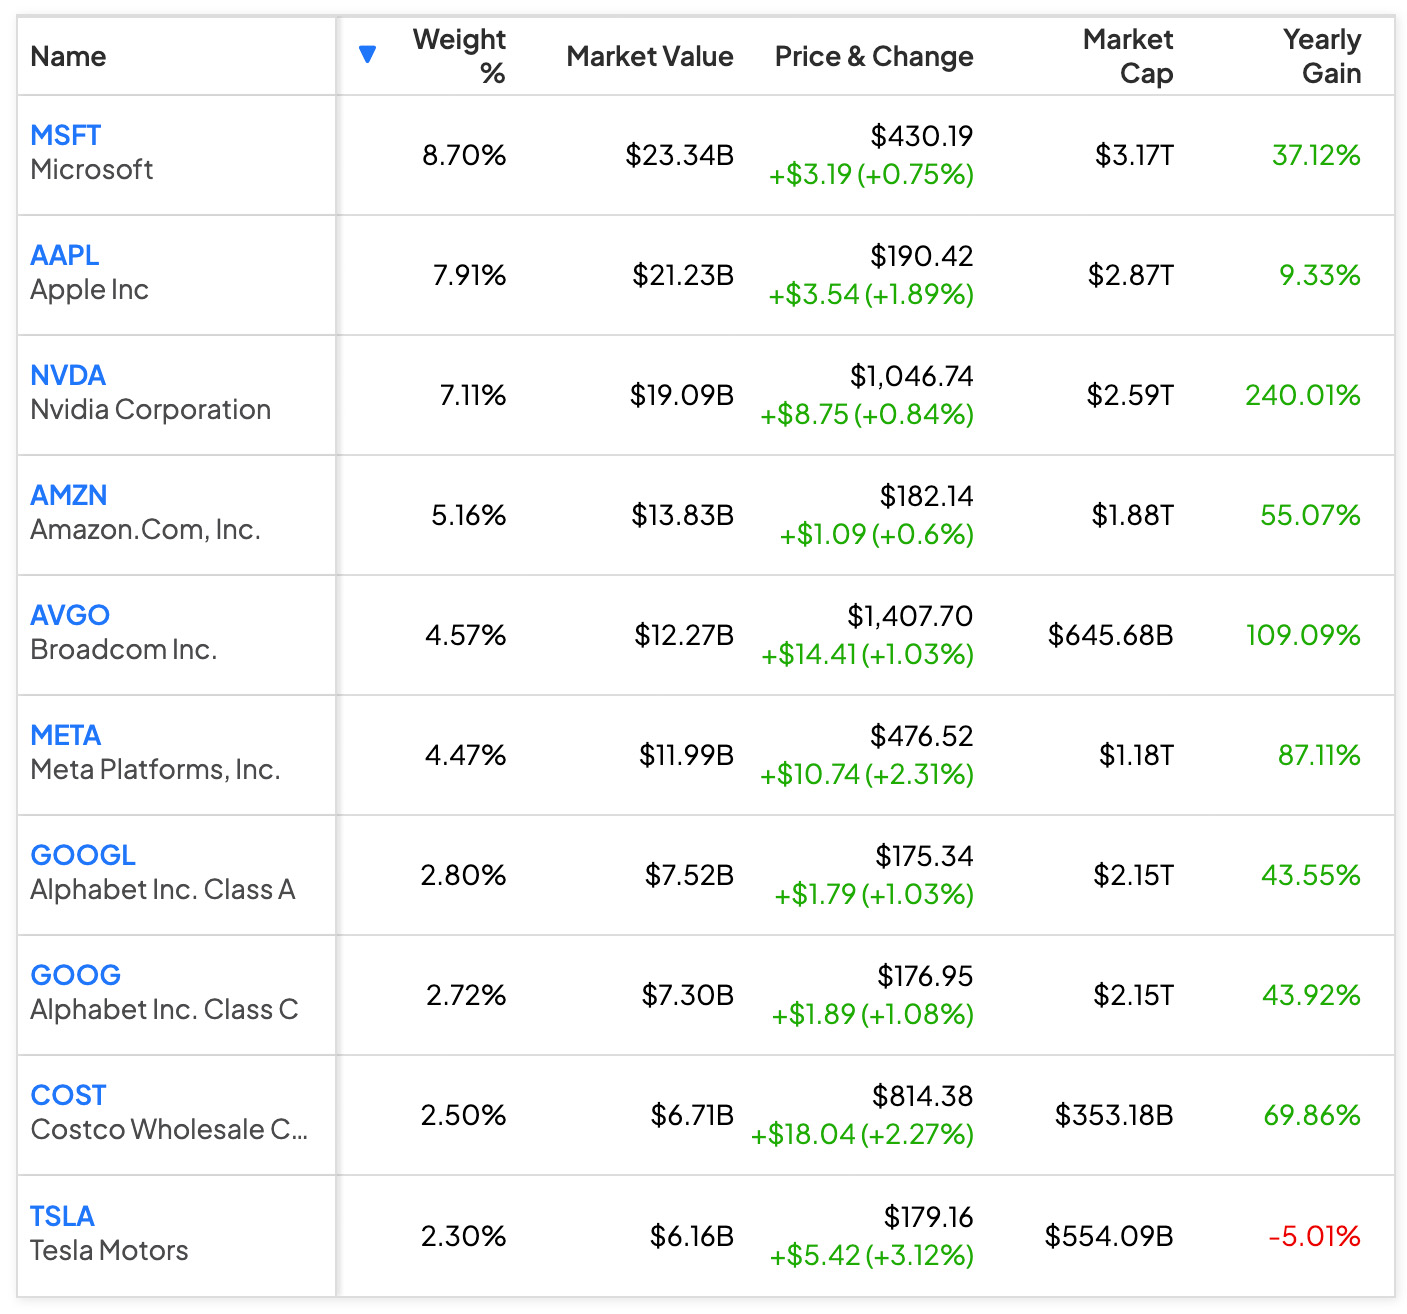
As of 05/24/2024
Notice that COST is in the Nasdaq 100 although it is not explicitly a technology company.
XLK, on the other hand, is focused exclusively on tech companies, with its top holdings typically including:
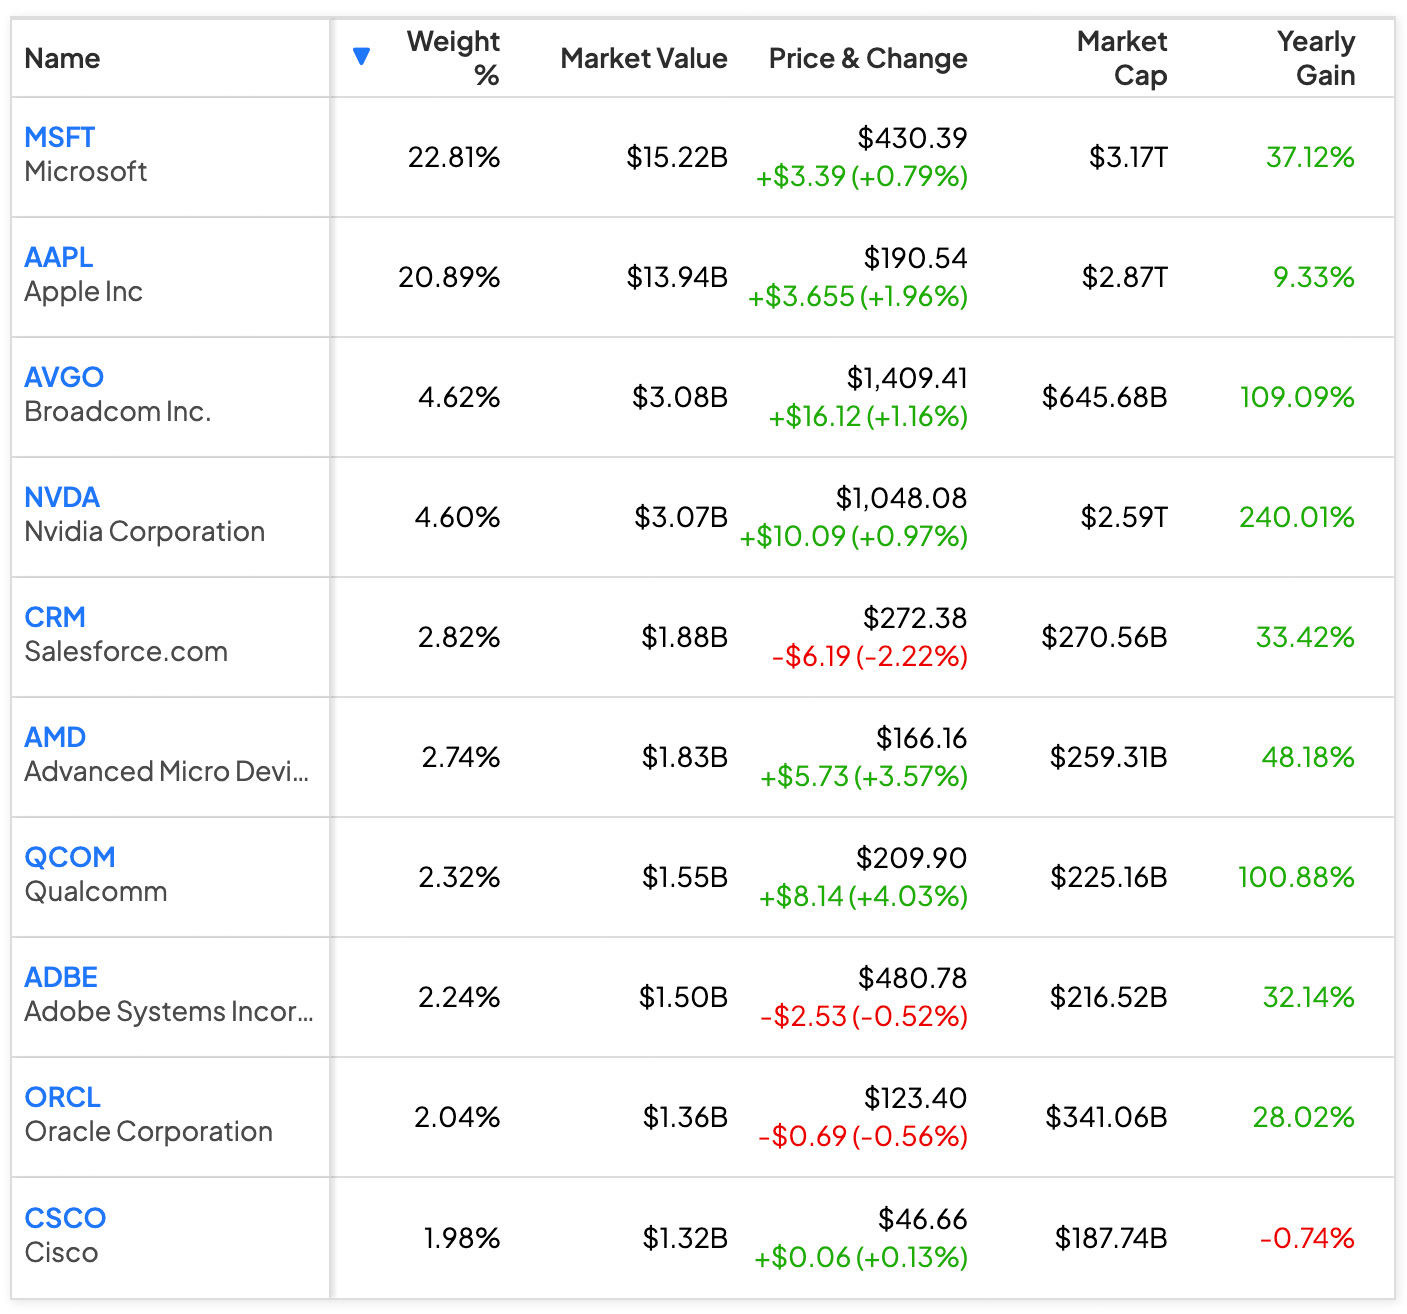
As of 05/24/2024
Notice here that TSLA is not included in the XLK sector, because it is grouped as a car company and included in the Consumer Discretionary sector.
Performance Comparison
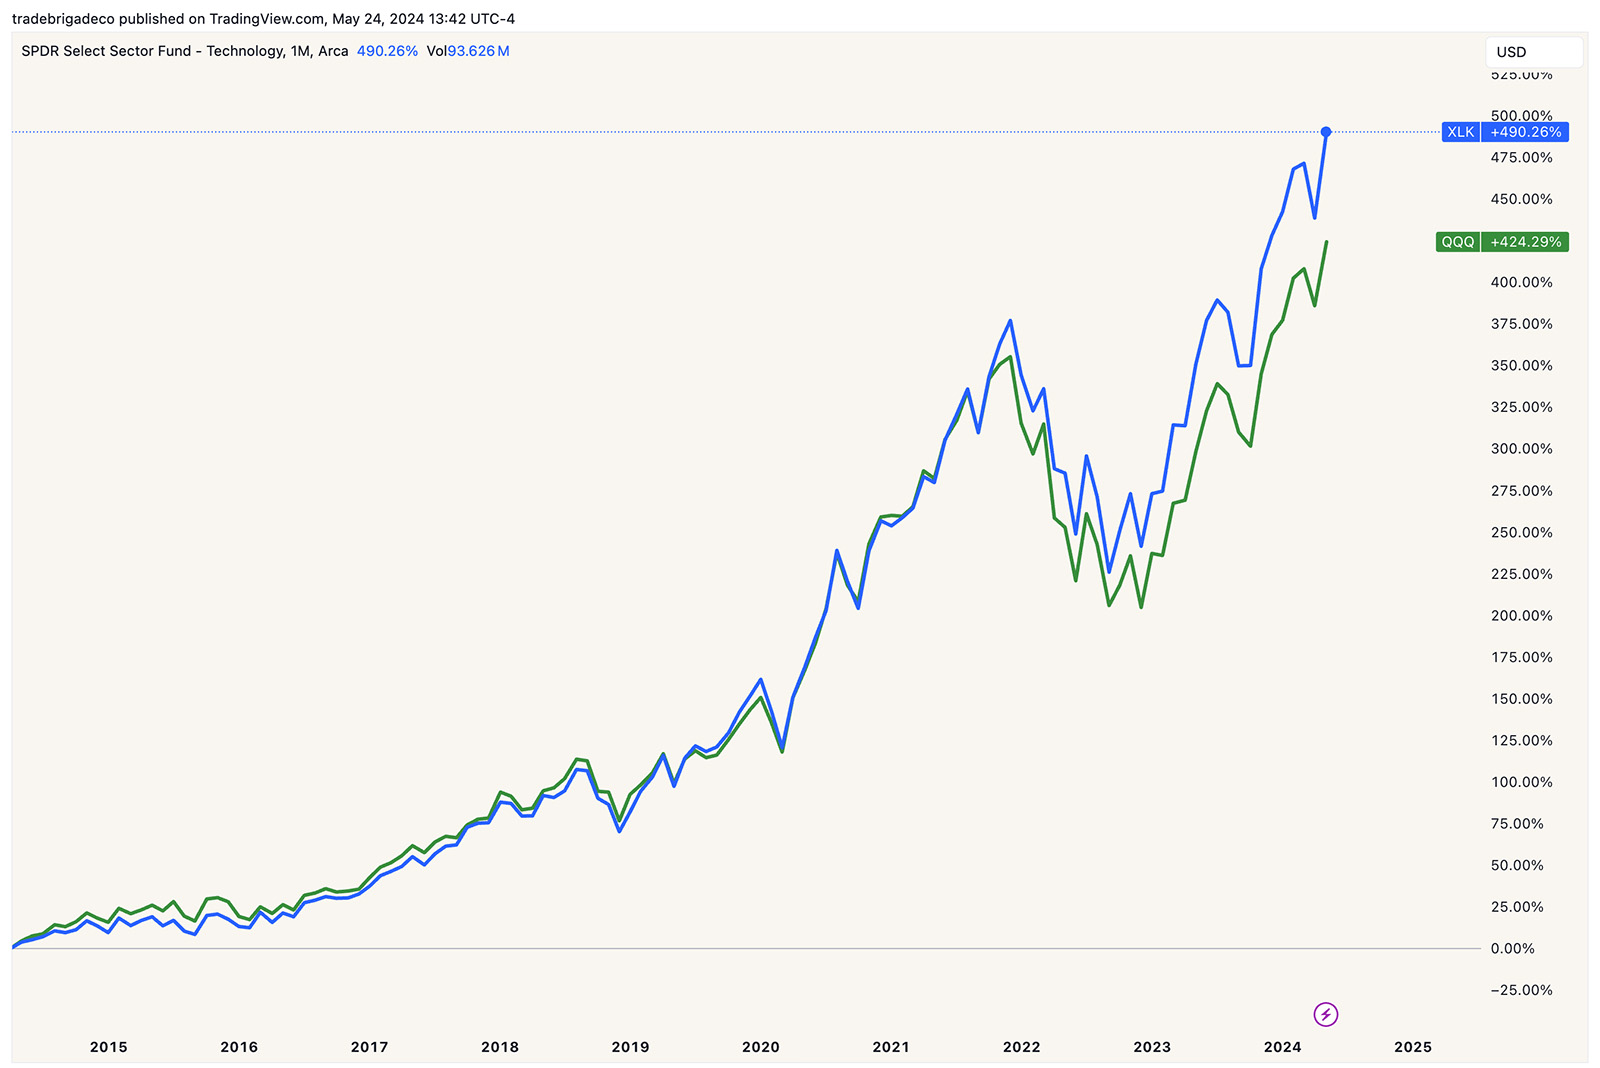
Performance metrics can be a deciding factor when choosing between QQQ and XLK. Historically, both ETFs have performed well, driven by the strong growth of the technology sector. However, there are some differences worth noting.
Since the “AI Revolution,” XLK has often outperformed QQQ due to the far heavier emphasis on NVDA. This hasn’t always been the case though, and the two have typically performed quite equally with the QQQ at times out performing the XLK thanks to its broader scope that includes high-growth non-tech companies like Amazon and Tesla.
XLK, with its narrower focus on technology companies, is often seen as the purer play on the tech sector, which can be advantageous during periods of significant tech growth.
Fees and Expenses
Both ETFs have relatively low expense ratios, but there are differences. As of now, QQQ has an expense ratio of 0.20%, while XLK has a slightly lower expense ratio of 0.09%. Lower fees can lead to higher net returns over time, especially for long-term investors.
Dividend Yields
Another point of comparison is dividend yield. While both ETFs offer some level of dividend income, XLK tends to have a higher yield at 0.63% paid quarterly compared to QQQ at 0.5% paid quarterly. Investors looking for a combination of growth and income might find XLK more attractive for this reason.
Risk Factors
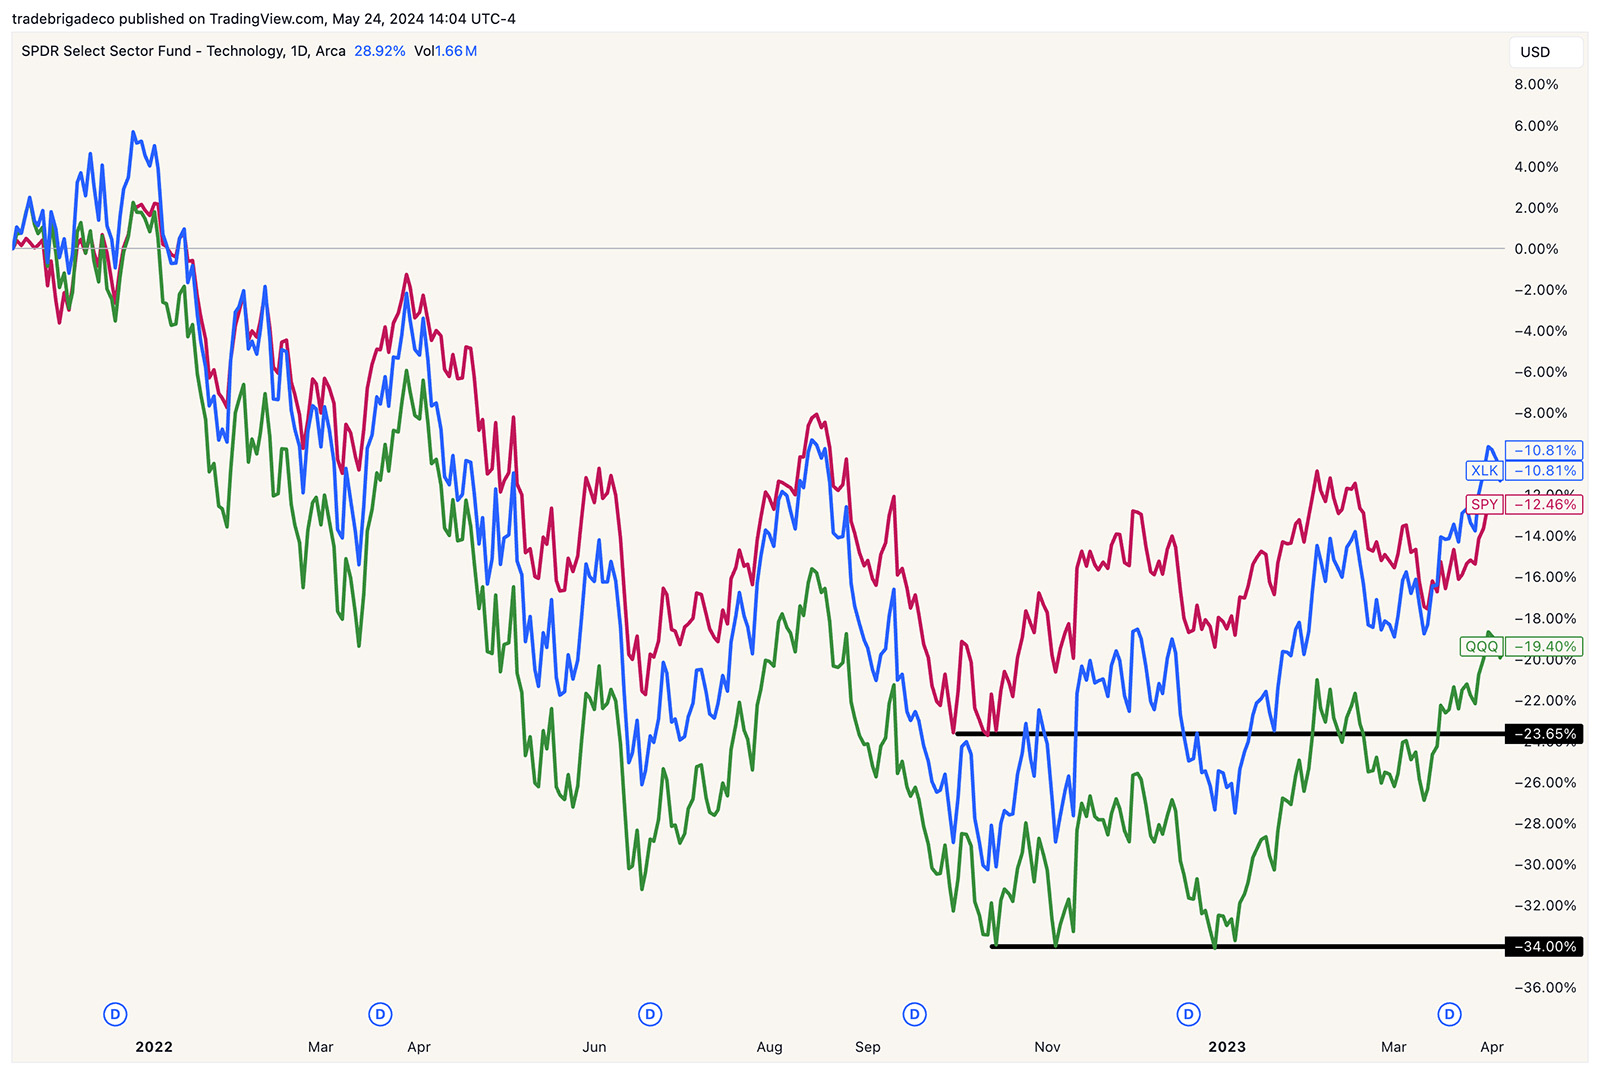
Investing in anything always carries some degree of risk, but generally there is a higher beta in the technology sector. The increased risk factor and volatility is driven by rapid innovation, regulatory changes, and market competition. Both ETFs offer the potential for high returns, but they can also experience substantial drawdowns.
Note the nearly 34% drawdown in the tech ETFs here vs the “only” 23.65% drawdown in the S&P 500 index as a whole. Although tech is back to outperforming the S&P 500 index, to capture this gain, investors needed to tolerate an additional 10% drawdown in 2022 compared to the benchmark.
Conclusion
Choosing between QQQ and XLK depends on your investment goals, risk tolerance, and sector outlook. QQQ offers broader exposure to large-cap growth companies, including but not limited to technology, making it a diversified choice within a tech-heavy framework. XLK, with its focused approach on the tech sector, provides a purer play on technology companies from the S&P 500, making it suitable for those who are confident in the tech sector’s forward growth. Both ETFs have strong track records, low fees, and solid holdings in major tech companies.