Understanding Risk-on vs Risk-off
Risk-on and Risk-off are terms that describe the degree of risk that investors are willing to take in the market. When risk-on signals are shown, investors are willing to take larger risks in the hopes for a larger return. When risk-off signals are shown, investors tend to limit the amount of risk they take, in the hopes of mitigating a larger loss, and shifting to a more defensive stance.
As a day traders we can use the risk on or off nature of the market to provide context clues at to how aggressive we should be with our trade plan. A solid understanding of technical analysis is always the bed rock of any trade thesis, but this helps build confidence on thesis direction.
Risk-On Trading
Risk-on as described, represents a market environment where investors are willing to allocate more capital to riskier investment strategies in the hopes of generating a larger return. Broadly speaking this would mean favoring equities that are growth oriented, emerging markets, or speculative non traditional investments.
Usually investors would have this type of view on the market when interest rates are low and “money is cheap.” When the cost of capital is low, more often, companies can spend on research and development in the hopes of achieving growth or the promise of future growth based on their efforts. Alternately cheap capital allows for growth via scaling, especially in the digital world. This is rewarded by P/E expansion and higher valuations across the board.
Aside from low interest rates, fundamental data from the economy can be an indication of risk on sentiment. When things like unemployment rate remain low, GDP and manufacturing output remains strong, inflation remains low, retail sales are sustainable, these can act as indications that the market is in a risk-on phase.
When markets are risk-on, the technology and consumer discretionary sectors tend to outperform the S&P on a relative basis. This should be straightforward due to the nature of technology being growth oriented and reliant on the promise of exponential growth in the future. The safe haven currency such as the dollar is usually weakening under these circumstances. Emerging markets also tend to see more attractive returns during a risk-on cycle as bets are being made about the future returns of any growth improvements.
Speculative assets will also benefit from a risk-on environment such as high end art, collectibles, wine, and even digital investments. Although it doesn’t have the history to back it, its undeniable that the crypto craze of 2018-2022 proved that not only coins, but most block chain technology massively benefited from a perfect storm of stimulus money and massive speculation.
Speculative assets may also act as defensive diversification or “store of value” during a risk-off rotation, so be mindful of the duality in this asset class, and don’t rely solely on it to only act as a risk on indication.
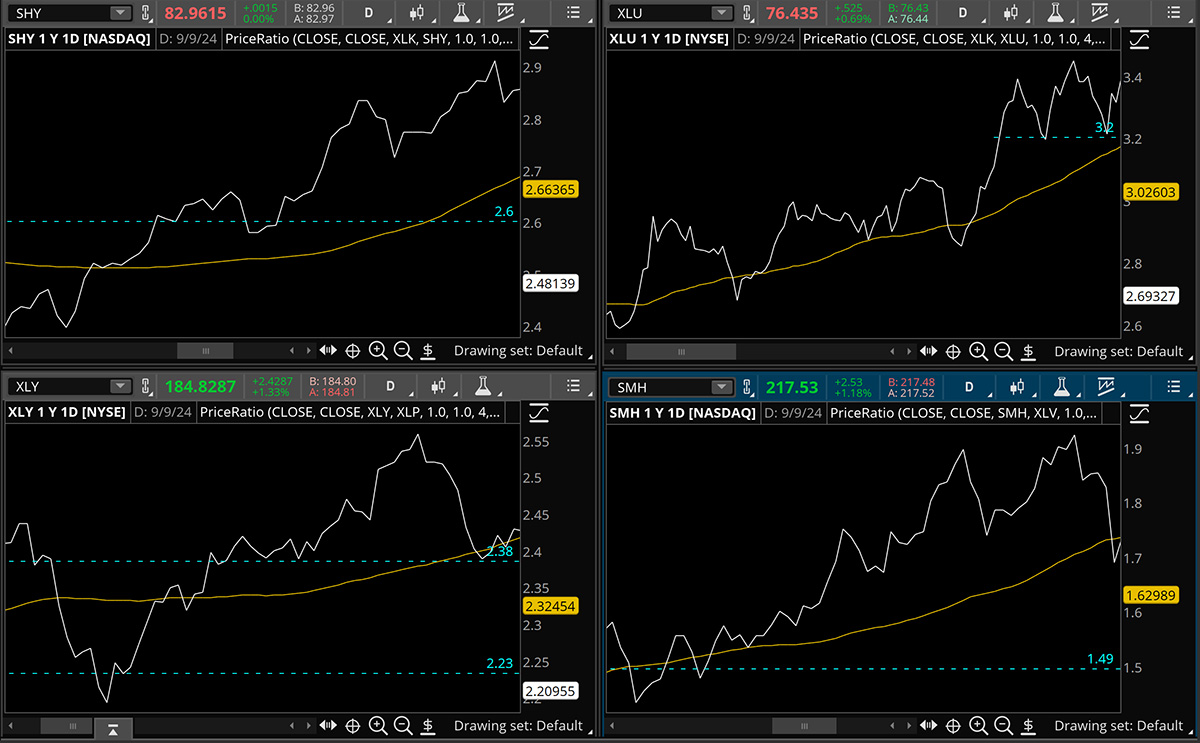
A technical display of this concept can be seen below. The charts in the quad grid are all ratios that express a risk on asset vs a risk off asset. Top left is XLK/SHY or the technology sector relative to the 1-3 year treasury bond ETF. When this ratio is in an uptrend, we can say that risk assets are more attractive than defensive assets. Top right is the XLK/XLU, bottom left XLY/XLP, bottom right SMH/XLV.
Risk-Off Trading
Risk-off sentiment is the exact opposite of what we just discussed above. In this environment, investors are fearful of larger drawdowns or market stagnation, and are trying to prevent large losses by limiting exposure to the risk-on cohort of assets.
This can be a symptom of weakening economic data, rising interest rates, all which might speak to elevated risks of a black swan event. Risk-off can also be a rotation which aims to reduce the exposure to market volatility. Remember that volatility is always the price to pay for larger returns. To avoid paying the psychological price of volatility and making an emotional decision, investors may opt for a smaller return, but a better night sleep.
The classic flight to safety assets tend to include things that will not be impacted by a downturn in the consumer’s ability to spend. Think about what goes first. No more discretionary spending, no more tech spending, just the bare necessities. So what are those assets?
Utilities are classically the most risk off indication. Everyone needs their utilities to live and most of the companies in the utilities sector offer a high dividend yield. They are able to do this because of their reliable revenue streams and low elasticity for demand. Utilities experience less volatility because of this, and can be an attractive place to achieve portfolio stabilization.
The healthcare sector also benefits from the dynamic that health spend can not be put off just because we are in a tougher economic environment. Consumer staples are another sector that benefits from the risk-off dynamic, but not nearly to the degree of utilities or even the healthcare sector.
Equites themselves have a higher risk profile than what is classically referred to as the “risk free rate of return” offered by a government backed bond. In periods of higher interest rates (which is not supportive of a risk-on environment) short duration bonds or treasury notes, even treasury bills become more attractive. If you can generate a “risk free” 5% return in a 13 week t-bill, why would you subject your capital to the equities market? When shorter duration yields eclipse the longer duration yields, oftentimes this is an indication of a lack of confidence in the economic outlook. People are signaling that they want something safe vs speculative, unwilling to take on additional risk.
In some severe instances of risk-off environments, money market accounts will also offer strong options for investors looking to park cash, but remain highly liquid. If money market inflows are dramatically outpacing the flow of capital into markets it should be a clear sign that investors lack confidence in the markets ability to generate a return.
Gold and hard assets are sometimes lumped into the category or risk-off assets, however the issue is their liquidity. It is far more difficult to find exit liquidity things that trade on exchanges like ETFs or even bonds at this point.
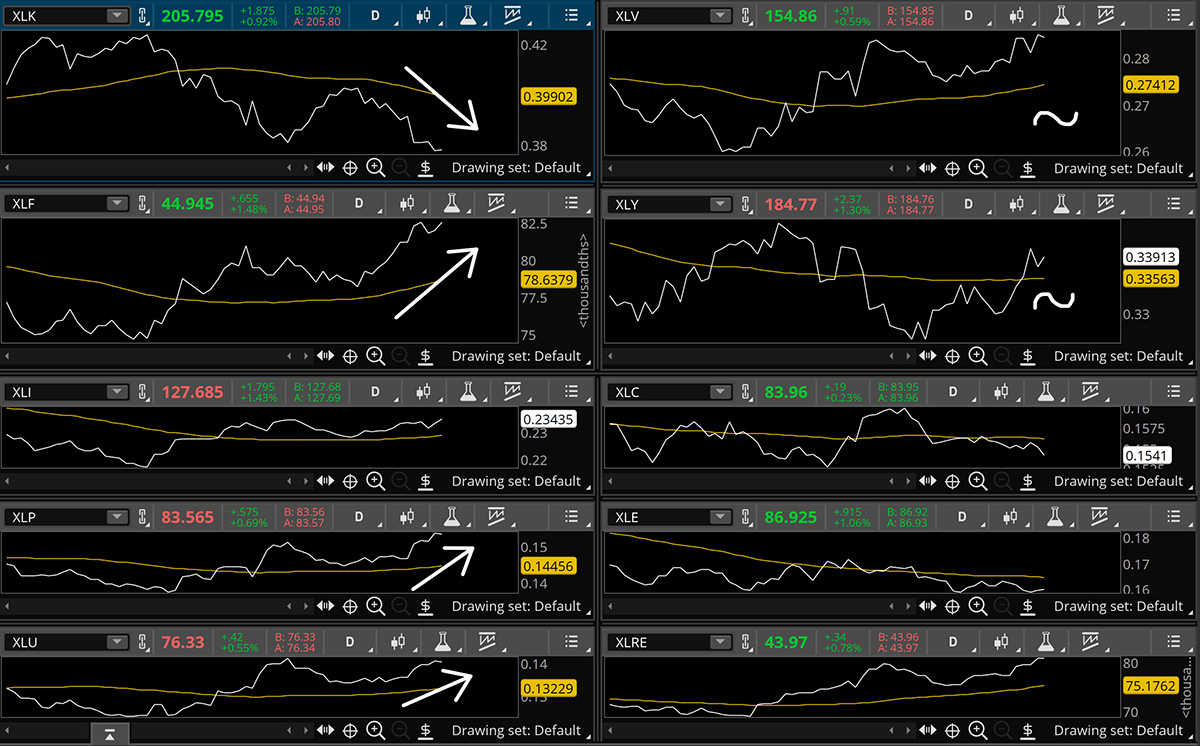
The below image represents a risk off situation in the market. These charts are ratios of each S&P sector to the SPY ETF. Notice that the tech sector XLK is in a relative downtrend. Notice that the consumer staples XLP and utilities XLU sectors are in relative uptrends. The financials sector XLF is trying to hold an uptrend, but there is more evidence in this dashboard that points to risk off vs risk on.
Using RORO To Trade The S&P500
So how do we put all of this in practice to trade the S&P or generally understand the market with better context? Well, if we are bullish the market it is very important that we see the risk on sectors leading any market rallies and the risk off sectors lagging any market rally. This would give us the confidence that the move higher was being supported by strong investor and trader sentiment, not just the fluke of an oversold bounce.
Contrast this with a move higher in the S&P broadly, but being driven by the lighter weight risk off style sectors. You would clearly want to be skeptical of that move and not become overly committed to long continuation under those conditions. Some might even start to position bearishly, expecting some kind of market reversal back in the downward direction.
The Bottom Line
If we are bullish, strong moves higher want to be led by the XLK, XLY, XLC to give us strong confidence. If that is not the case and we see leadership out of the XLU, XLV, XLP, we adjust our tone to avoid the long side and remain neutral, or for the more risk tolerant, you might start building a short position.
If we are bearish, we want to see full correlation to the downside. Markets make the strongest move when everything is weak. It’s usually not enough to just have the heavy weight sectors lagging. When that’s the case and risk off sectors are moving higher, you often get consolidation in the market. When the stars align and we get heavy weight risk on sectors lower as well as lighter weight risk off sectors moving lower, markets take the elevator down.
For more detail and statistics on utilities and their relationship to a risk off beta rotation strategy, reference this award winning paper: An Intermarket Approach to Beta Rotation: The Strategy, Signal and Power of Utilities.