What is the S&P 500?
The S&P 500, short for Standard & Poor’s 500 index, is the most well-known stock market index that tracks the performance of the top 500 large-cap companies listed on the US stock exchanges. A large-cap company is a company worth more than $10 billion. These 500 companies cover almost 80% of the total market capitalization of all publicly traded stocks in the United States. As one of the most widely followed equity benchmarks, the S&P 500 provides investors and traders with an idea of how the US stock market is performing as a whole.
The S&P 500 was created in 1957 by S&P Dow Jones Indices, a division of S&P Global and is still maintained by them to this day. The criteria for a company to be listed in the S&P 500 includes but is not limited to:
- It must be a U.S. company.
- It should have an unadjusted market cap of at least $12.7 billion and a float-adjusted market cap of at least 50% of that minimum threshold.
- It must have positive as-reported earnings over the most recent quarter as well as over the four most recent quarters combined.
- Its ratio of annual dollar value traded to the float-adjusted market cap should be at least 0.75 “at the time of addition to the Composite 1500” and the stock should trade a minimum of 250,000 shares in each of the six months leading up to the evaluation date.
The stocks that meet the criteria can come from all 11 sectors of the economy; technology, healthcare, finance, consumer discretionary, industrials, communications, consumer staples, energy, utilities, real estate, and materials. Because of this, the S&P 500 is oftentimes seen as a diversified basket of the most financially stable companies in the United states.
How is the S&P 500 Value Calculated?
The S&P 500 is a market-cap-weighted index, which means that the weight of each company in the index is determined by its market capitalization. Market capitalization is calculated by multiplying the company’s stock price by the number of its outstanding shares. As a result, larger companies with higher market capitalizations have a greater impact on the index’s performance.
The current weights (August 5, 2023 – Reference S&P global for latest) for the S&P 500 by sector are as follows:
- XLK Technology – 27.85%
- XLV Healthcare – 13.3%
- XLF Financials – 12.62%
- XLY Consumer Discretionary – 10.43%
- XLC Communications – 8.62%
- XLI Industrials – 8.54%
- XLP Consumer Staples – 6.64%
- XLE Energy – 4.27%
- XLU Utilities – 2.56%
- XLB Materials – 2.5%
- XLRE Real Estate – 2.5%
The top 5 heaviest weighted stocks are:
- AAPL (Apple Inc) – 7.55%
- MSFT (Microsoft Corp) – 6.45%
- AMZN (Amazon.com Inc) – 3.03%
- NVDA (Nvidia Corp) – 2.9%
- GOOGL (Alphabet Inc) – 2.02%
Average Returns of the S&P 500
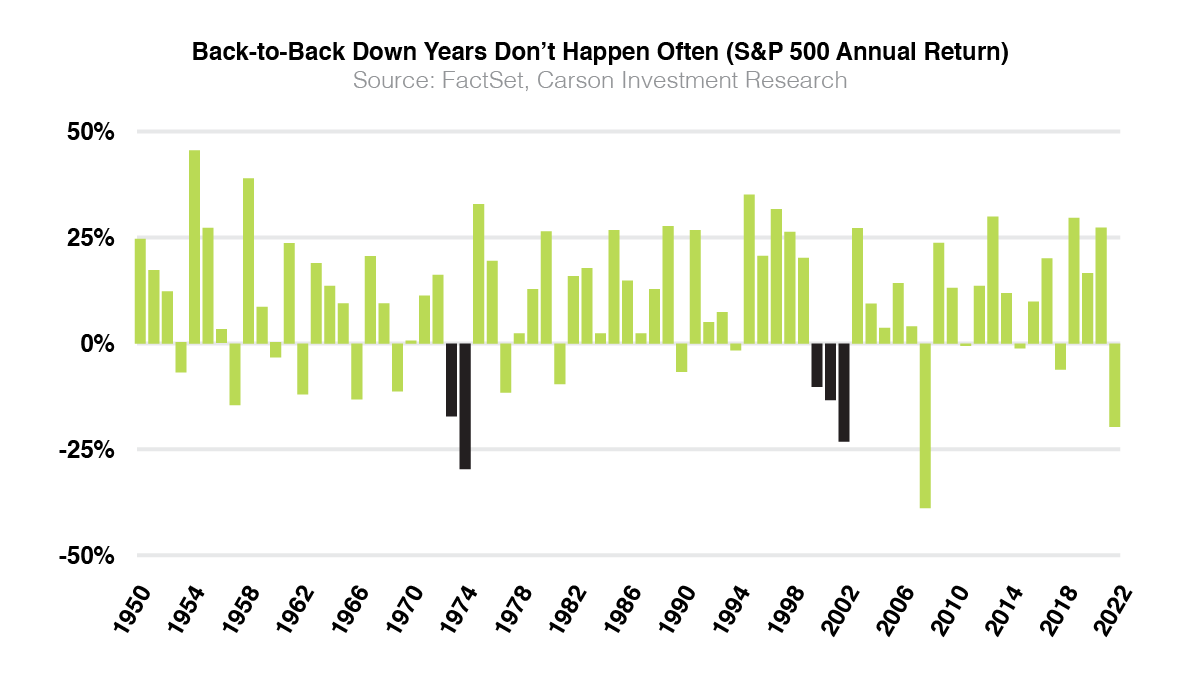
Historically, the average annual return of the S&P 500 has been around 7% to 10% when adjusted for inflation. The S&P 500 has consistently been the main benchmark to gauge investor’s return in the stock market. Although from year to year returns may vary, the S&P 500 has reliably generated positive gains over the long term. In any 20 year rolling period tracking the index, there has never been a negative return. If you “beat the market” you did better than the S&P 500 that year. If you underperformed… well it might be time to go back to the good ole buy and hold strategy.
The average return is not guaranteed, and it’s actually uncommon for the S&P to return an exact 7% to 10% every single year. Periods of volatility and market downturns impact the index’s performance. Sometimes after a flat to down year where the S&P returns less than the average 7% to 10% the index has a period of beating the average with returns closer to 20%. Note that there are not frequent periods when the S&P 500 generates a negative return for more than one year.

How Do You Invest In The S&P 500?
You can invest in the S&P 500 by buying shares of an index fund that targets the index. When it comes to investing you’ll want to consider the expense ratio of the fund in your overall investment plan. As a trader this expense ratio doesn’t matter so much. Some of the most common examples of funds that track the S&P 500 are:
- SPY (SPDR® S&P 500® ETF Trust)
- VOO (Vanguard S&P 500 ETF)
- IVV (iShares Core S&P 500 ETF)
How Can You Trade The S&P 500?
There are multiple ways in which trading the S&P 500 is different from investing in the S&P 500. Firstly because traders often have a short term time horizon the expense ratio we discussed earlier becomes irrelevant. Instead traders should focus on liquidity to enter and exit positions with minimal slippage. Second, traders can consider if they want to buy and sell shares, options, or futures on the S&P 500. The largest and most leveraged product would be SPX options, followed by /ES futures, and then SPY options. Before starting to trade the S&P or any product for that matter, you should have a solid understanding of technical analysis.
Conclusion
The S&P 500 is a major stock market index that represents the performance of 500 large-cap US companies and acts as a benchmark for investors and traders. Its diversified coverage of the US stock market and its market-cap-weighted sectors contribute to its importance and popularity. By understanding the S&P 500 you are one step further in understanding “the market.”
