Understanding Average True Range (ATR) in Trading
As you start trading or learning about trading, you’ll encounter many indicators to help understand market movements. One effective and simple indicator is the Average True Range (ATR). When taken at face value, it simply describes what a “normal” move might look like in a specific stock. Here’s exactly what ATR is, its benefits, and how to apply it in your trading.
What is Average True Range (ATR)?
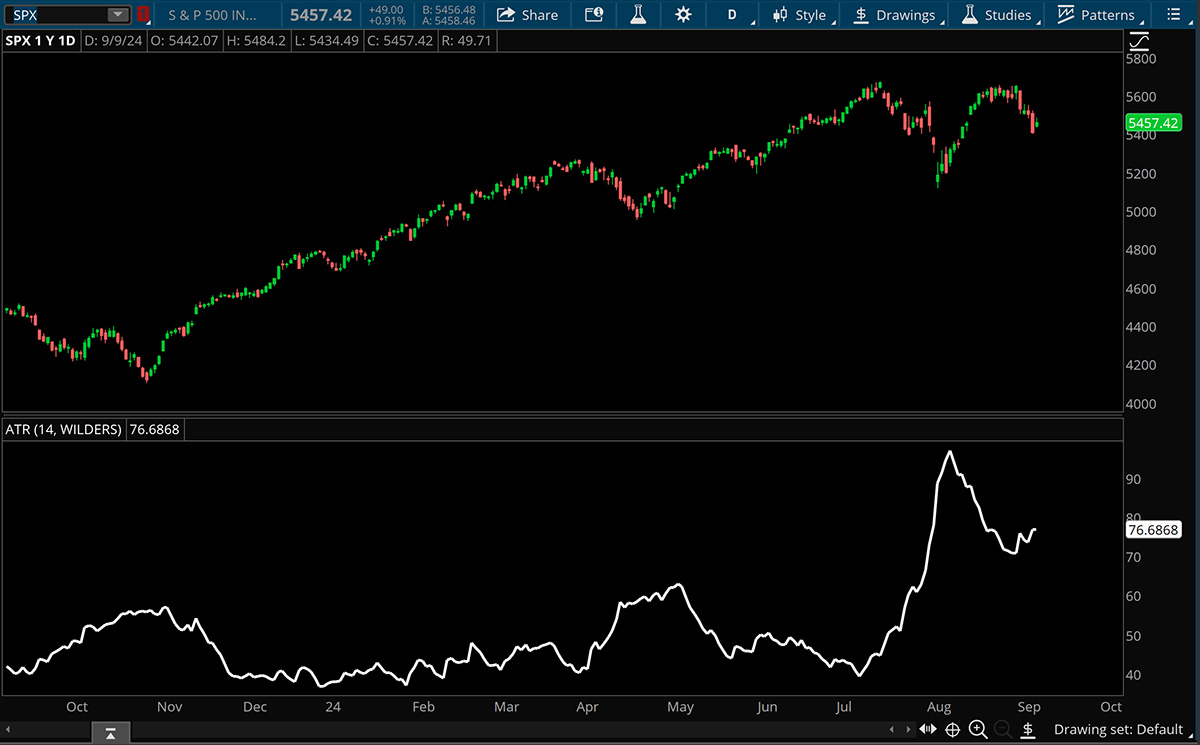
ATR measures market volatility by taking the average of true ranges over a set period, usually 14 days. This is how it works:
- True Range: This is the largest of:
- The current high minus the current low.
- The absolute value of the current high minus the previous close.
- The absolute value of the current low minus the previous close.
- Average: The true range values are then averaged over the chosen period.
Why Use ATR?
Volatility Indicator: ATR tells you how much the price of an asset typically moves, which can help you gauge the risk. Is there a lot more potential range to move through? Is the stock only up 1% when on average it moves 3%? Or is there becoming less “available” range to move? Up 2.75% out of the average 3%?
Setting Stops: It’s useful for setting stop-loss orders. A higher ATR might suggest you need a wider stop to avoid getting stopped out by normal market noise.
Position Sizing: Helps in deciding how much to trade. If a stock has a high ATR, you might want to trade smaller sizes to manage risk.
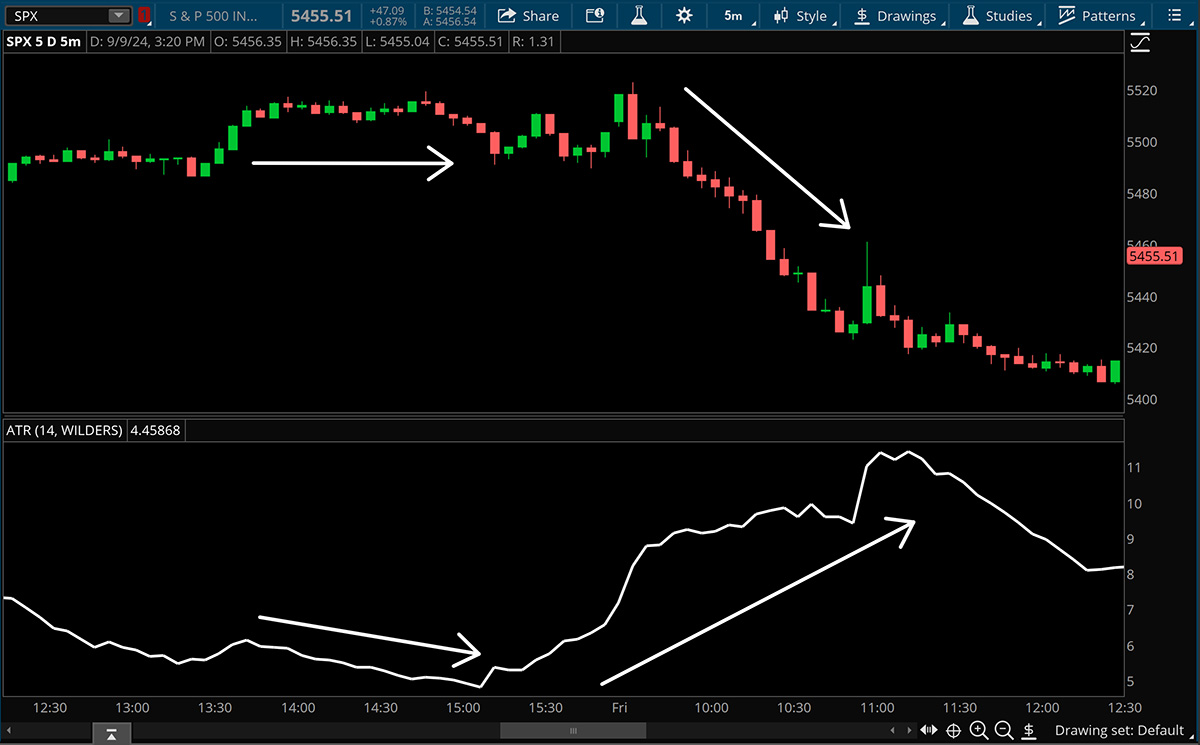
Trend Strength: A rising ATR can signal increasing volatility, often seen in strong trends. Conversely, a falling ATR might suggest the market is consolidating. In the below image, the ATR falls as the S&P consolidates on the Thursday afternoon. ATR then accelerates when the market starts trending. Often time a spike in ATR is associated with volatile downtrends.
Limitations of ATR
The average true range study is a descriptor of volatility, not necessarily price direction. Generally a price action strategy will be required for directional thesis development. It can certainly help us manage our expectations of what a stock can do, but should not be used to make directional decisions.
Like any study based on historical price movements it is a lagging indicator. There is no guarantee that a stock will stay contained exactly within the forecasted ATR. It can offer a useful reference point, but should not be used as a “holy grail.”
Conclusion
The Average True Range is a simple indicator to better understand market volatility. By incorporating ATR into your analysis, you can make more precise decisions about where to place stops, how to size your positions, and when moves are getting exhausted relative to historical averages. Remember, while ATR provides valuable information about market movement, it’s best used in conjunction with a price action strategy and comprehensive trading plan that includes a full risk management plan.