Market Profile: Spikes and Spike Rules
Market profile is a great way to visualize price action based on volume and time. The 30-minute periods that print can show us where prices traded, and for how long they traded there. The market profile has specific nuances that allow traders to use certain frameworks when certain signals develop.
What is a Spike?
A spike in the market profile occurs when there is a sudden and often dramatic price movement outside of the established balance area for the day. This movement must happen during the final 30-minute period of the trading day, representing a final push in one direction as market participants react to new information or exhaustion of the opposite side of the trade.
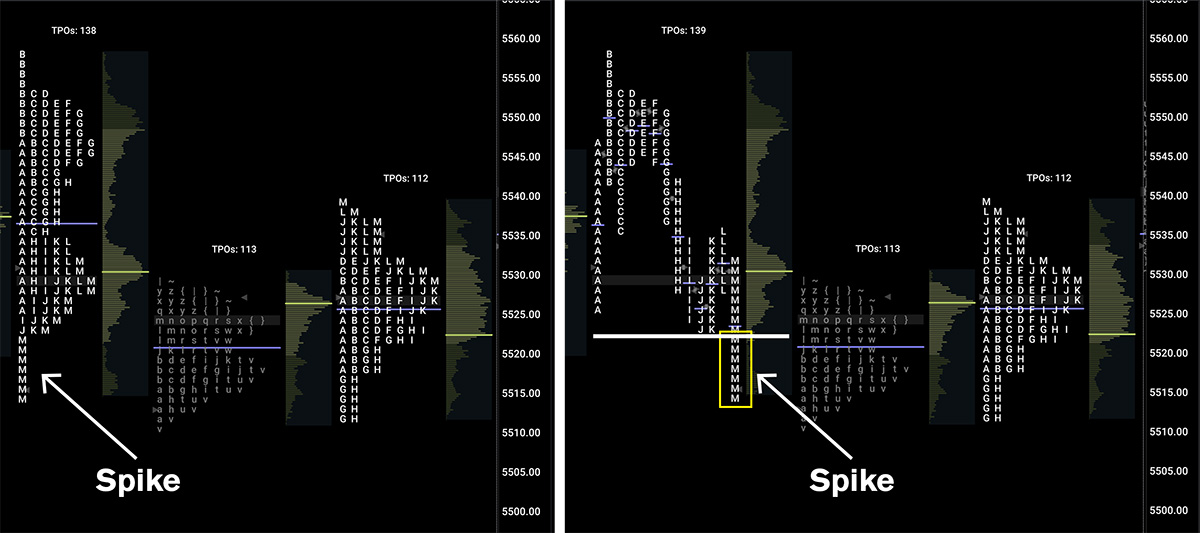
Spikes can occur on both the upside and downside, indicating either aggressive buying or selling. The final period of the day is “m” and this should result in “m” single prints sticking out of the top or the bottom of the composite profile for the day. Note in the below example, it is the same spike with both an expanded and composite profile illustrating the end of day move that creates the spike in the first place.
The Psychology Behind Spikes
When a spike occurs, it suggests that the market is reacting to a significant piece of news or event that causes traders to rush to adjust their positions. The tempo (speed) and intensity of this reaction create the spike, leaving behind single prints that mark the path of the market’s response.
James Dalton, the godfather of market profile, emphasizes that spikes reflect a moment of decision-making among traders. The market is essentially “testing” new territory, and how it behaves in the aftermath of the spike will determine whether the spike represents a true price discovery process or simply a temporary response.
You can also use the mental framework that the market only stopped auctioning higher or lower because the market literally closed at 4pm which causes the spike to print in the first place. We do not know if the spike prices are fair or unfair. If the market was open for another two hours, would prices have continued? Would there have been a reversal? So the following day we use a set of rules that allow traders to more easily determine what the market is trying to suggest.
Analyzing Spikes
Understanding and interpreting spikes requires a grasp of the following key rules, as outlined by Dalton:
- Spike Base as a Reference Point: The base of the spike, or the area where the spike begins, is a critical reference point. This level often serves as future support or resistance, depending on the market’s response in subsequent sessions.
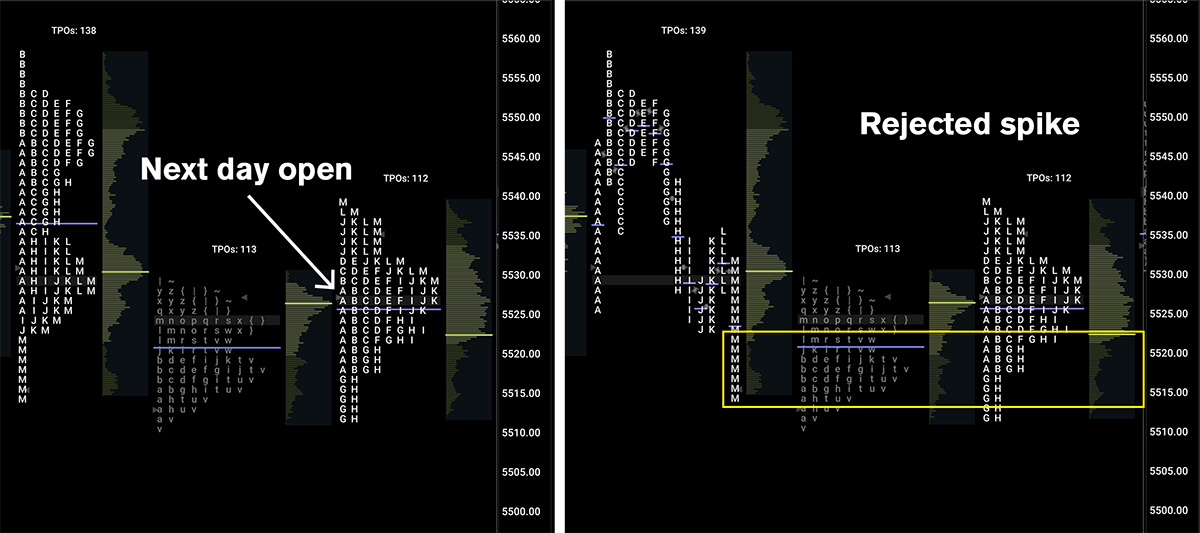
- Acceptance or Rejection: After a spike, the market will either accept or reject the new price levels. Acceptance occurs when the market continues to trade and build value above or below the spike base. Rejection, on the other hand, happens when the market fails to find value at these levels and returns to the previous balance area.The below example illustrates a rejected spike, where the market opened above the spike base, and failed to develop new value in the downward direction.
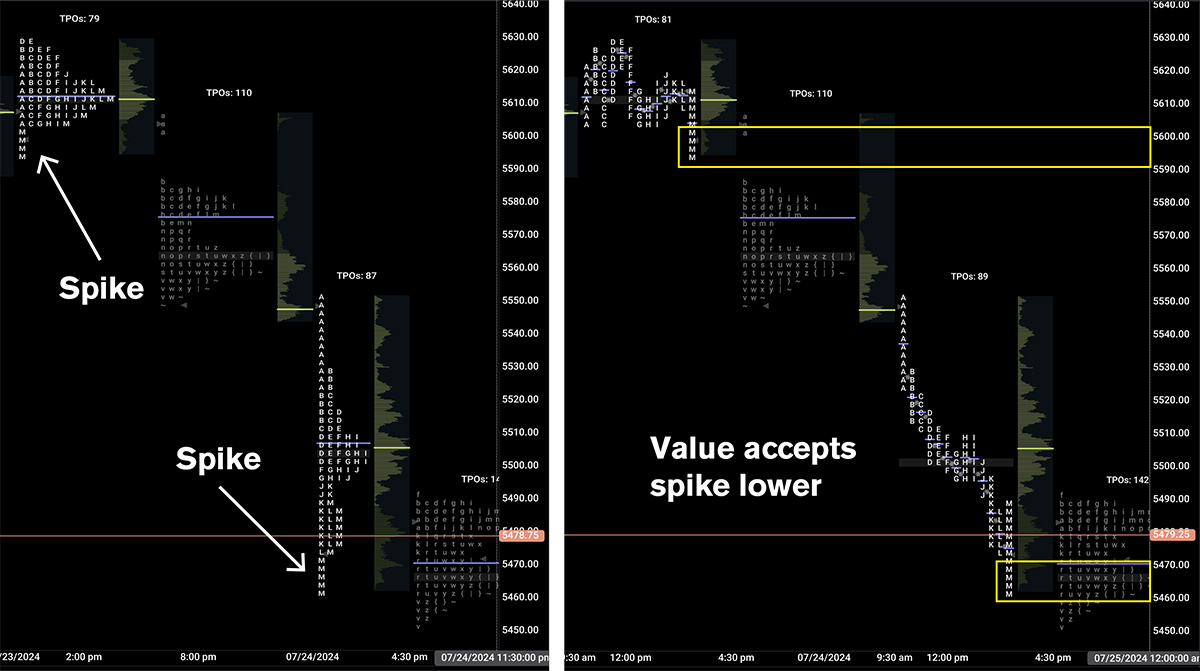
- Spike Extension: If the market extends beyond the spike’s range in subsequent sessions, it suggests that the directional move is likely to continue, and the spike was not just a short-term emotional reaction but part of a larger trend.
- Volume Considerations: The volume accompanying a spike can provide additional context. High volume during a spike indicates strong conviction among traders, whereas a spike on low volume may suggest that the move is unsustainable and more likely to be rejected.
For more nuances on the market profile, read more from the godfather himself Jim Dalton. This book is dense, but a great thorough investigation of decades studying the auctioning of markets.

Practical Application: Trading the Spike Rules
For traders, understanding spikes is not just about recognizing them but also knowing how to respond. When a spike occurs, it offers a clear framework for making trading decisions. For these rules lets assume a spike in the upward direction. Inverse the rules for a bearish spike in the downwards direction.
- Opening on a gap up over the spike high should indicate that the market is trying to auction higher. In this situation there are either no sellers or buyers are simply still too aggressive for sellers to influence price to move lower.
- Opening in the spike range should indicate bullish acceptance, but with respect to the spike high and spike base. In this situation, traders should look for reactions off of the spike base or high of the prior days range.
- Opening below the base of the spike implies there is a rejection of the spike prices in the overnight session and that the move to end the prior day was more emotional than substantial. Markets should auction lower near the open as buyers who participated in the spike are invalidated on the new day open.
Conclusion
Spikes in the Market Profile are more than just dramatic price movements; they are windows into the market’s collective psyche. By understanding the underlying dynamics of spikes and applying the rules laid out by James Dalton, traders can better navigate these critical moments and align their strategies with the market’s evolving sentiment.
Whether you’re a seasoned trader or new to Market Profile analysis, the concept of spikes is an essential tool in your trading arsenal. As Dalton suggests, it’s about seeing the market for what it is—a dynamic entity driven by the decisions and emotions of its participants. And in moments of extreme emotion, such as during a spike, the market often reveals its true intentions.