2024 US Financial Markets Outlook
Don’t Make a Promise You Can’t Keep: AI & Rate Cuts
2023 Calendar Year Performance Snapshot
| S&P 500 (SPX): 23.78% | Bitcoin (BTC): 154.69% |
| Nasdaq 100 (NDX): 52.43% | U.S. Dollar ($DXY): -2.23% |
| Russell 2000 (RUT): 14.53% | Commodities (DBC): -9.52% |
| Vanguard Total Bond Market Fund (BND): 1.51% | Crude (/CL): -11.46% |
| Gold (GLD): 11.58% | Ten Year Yield (TNX): 2.87% |
Preface
Accurately predicting the stock market’s movement over the span of a year is a very difficult task. There are an infinite number of black swan events that may arise in 2024 that we can not prepare for. Wall Street strategists continuously refine their predictions when new information becomes available and often their yearly price targets change just weeks after publication.
The point of this report is not to precisely pick the exact closing print of the S&P 500 in a year. Instead, it’s an exploration of the major themes present in the market that provide insight into potential headwinds and tailwinds. Once identified, we can assess the conditions that would favor either market improvement or market decline. To understand what the future may hold, we must first understand the past.
The 2023 Surprise
Most economists, market forecasters, and large Wall Street strategists saw 2023 being the year of a recession, with inflation running still far too hot, a Fed lift-off that was the fastest in recent history, and labor force participation not catching up to pre-pandemic trend. The classic 60/40 portfolio offered no safe haven in 2022, and bonds continued to suffer for the bulk of 2023, only recovering in the last quarter.
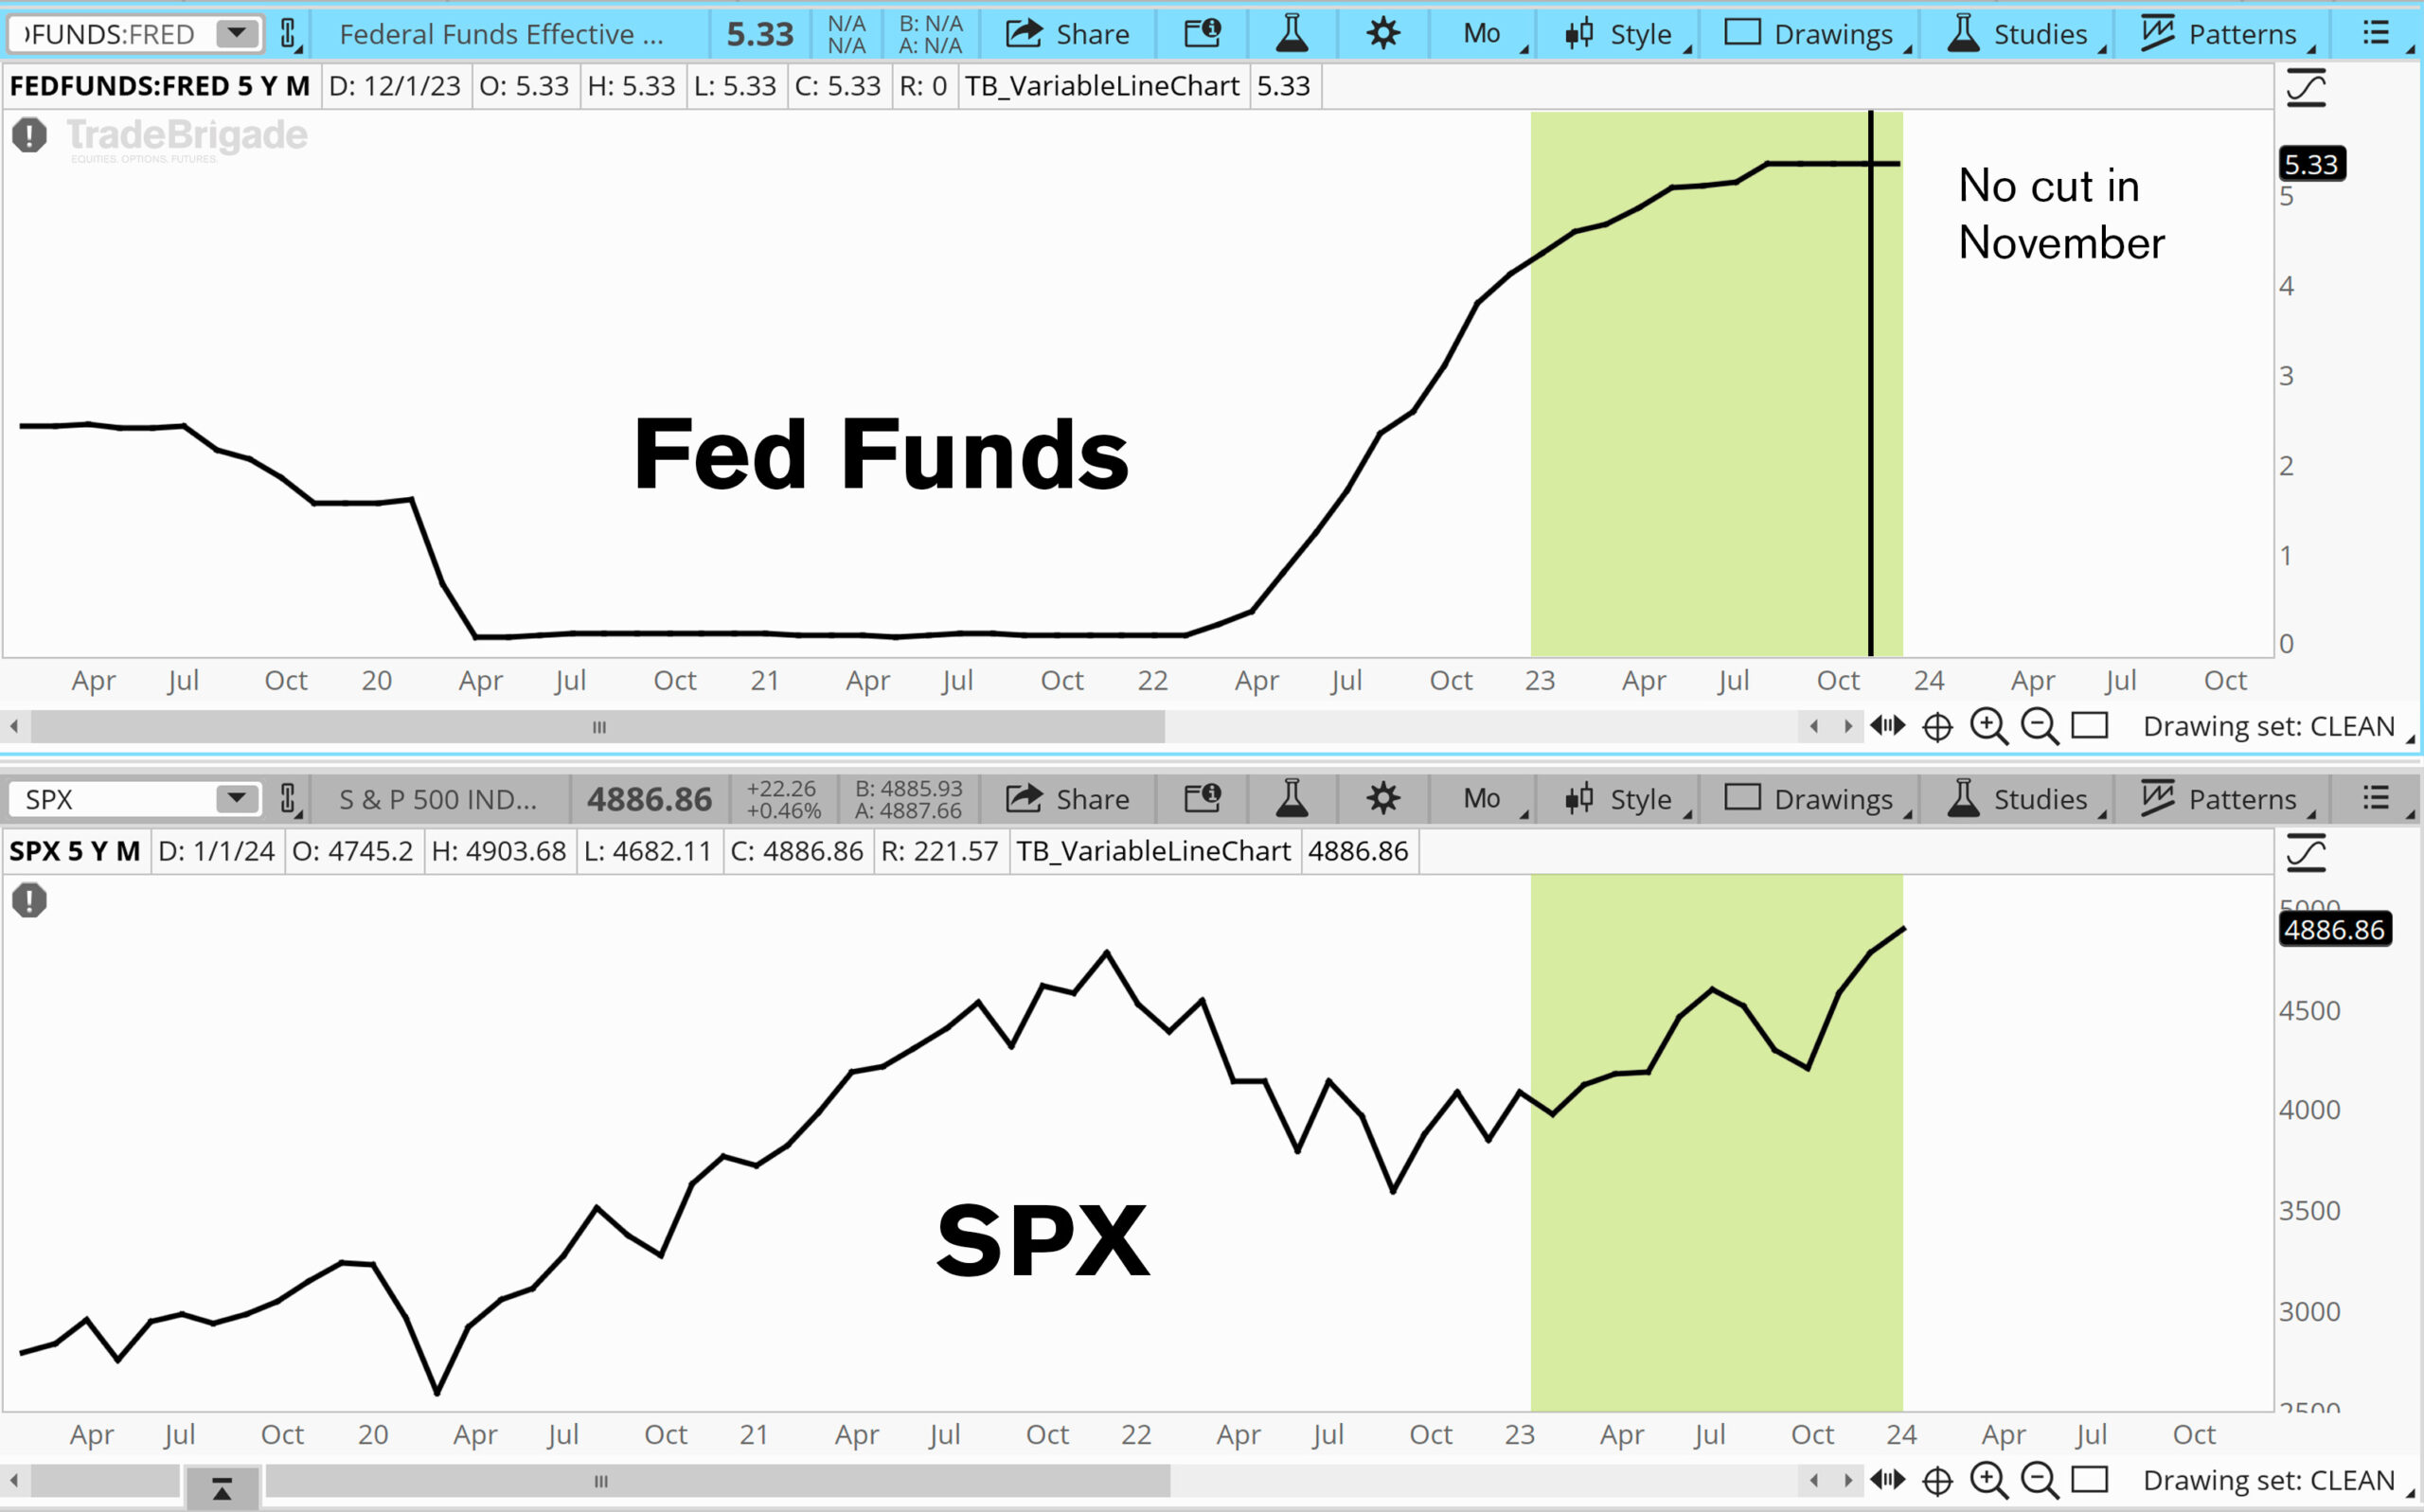
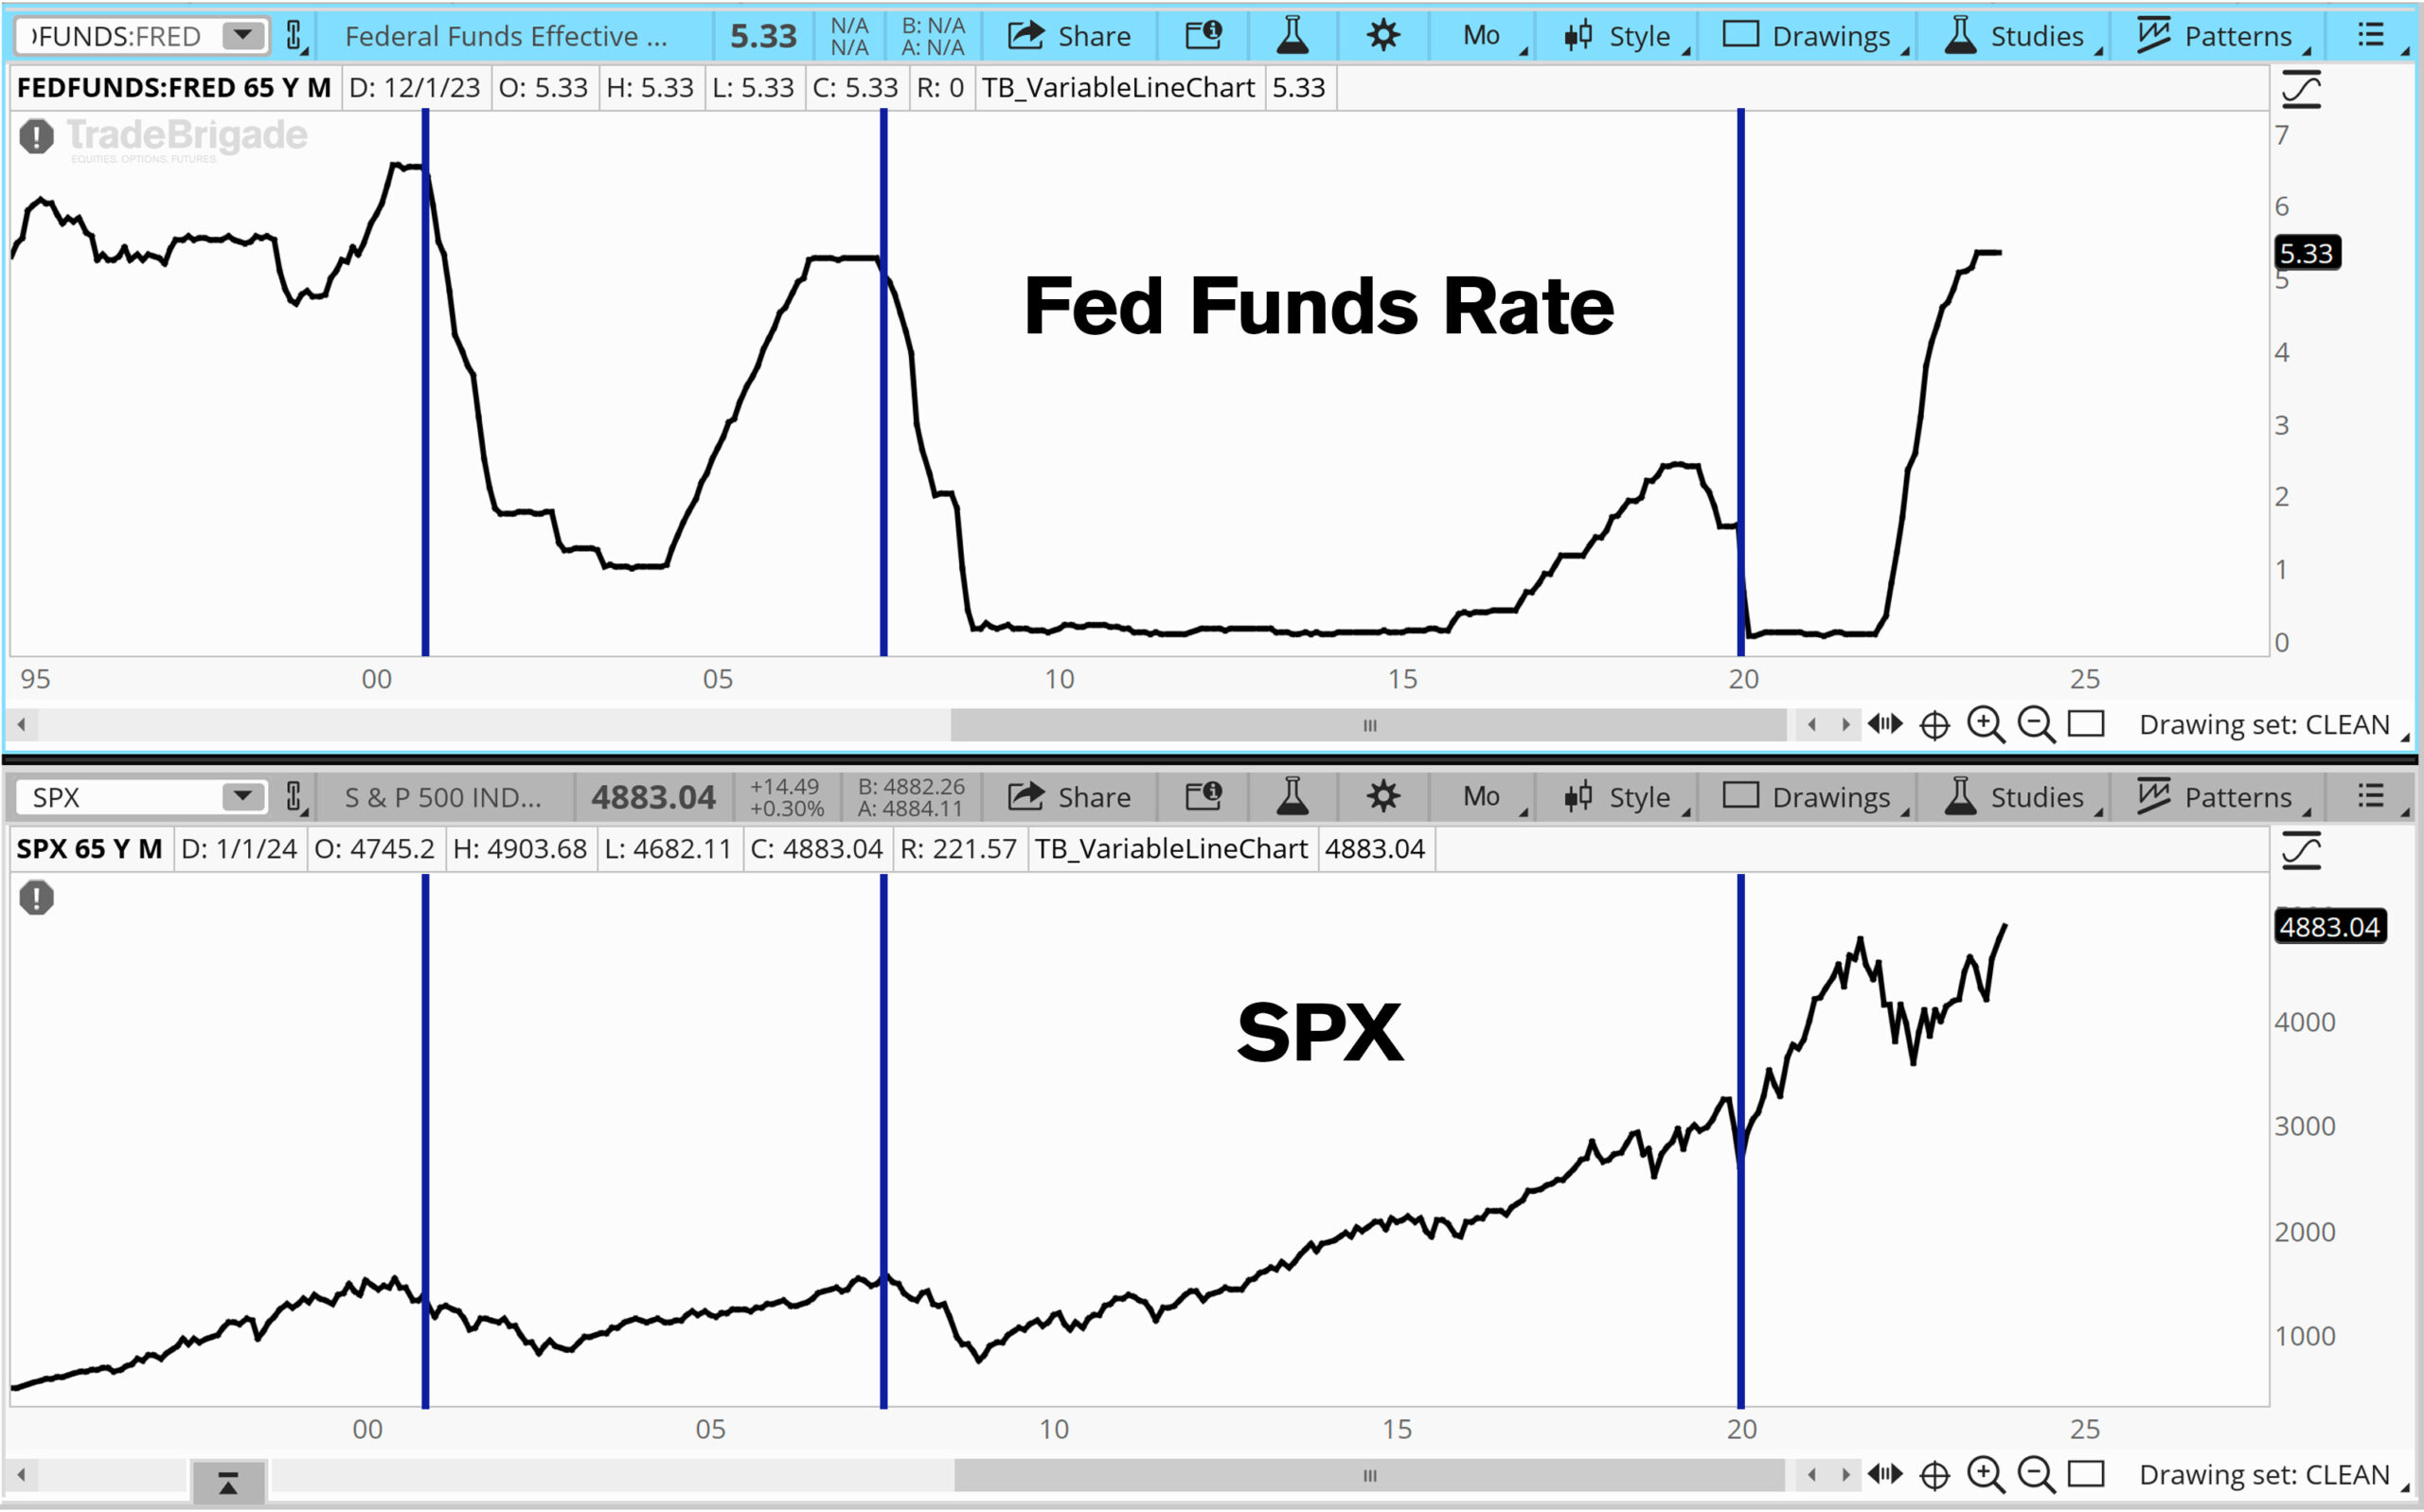
Equities threw caution to the wind in 2023 as benchmark indexes rallied in the face of four additional rate hikes, totaling 100 basis points from the Fed between January and August 2023. Jerome Powell remains committed to the ‘higher for longer’ stance and did not cut rates in November 2023, contrary to the expectation projected by Fed fund futures as of January 2023.
The primary drivers of the rally in both bonds and equities touch on the two big themes we continue to watch into 2024. Inflation falling to the Feds target, with a strong labor market suggests the promise of rate cuts and the continued performance from the Magnificent 7 based on the promise of AI.
Inflation Subsides
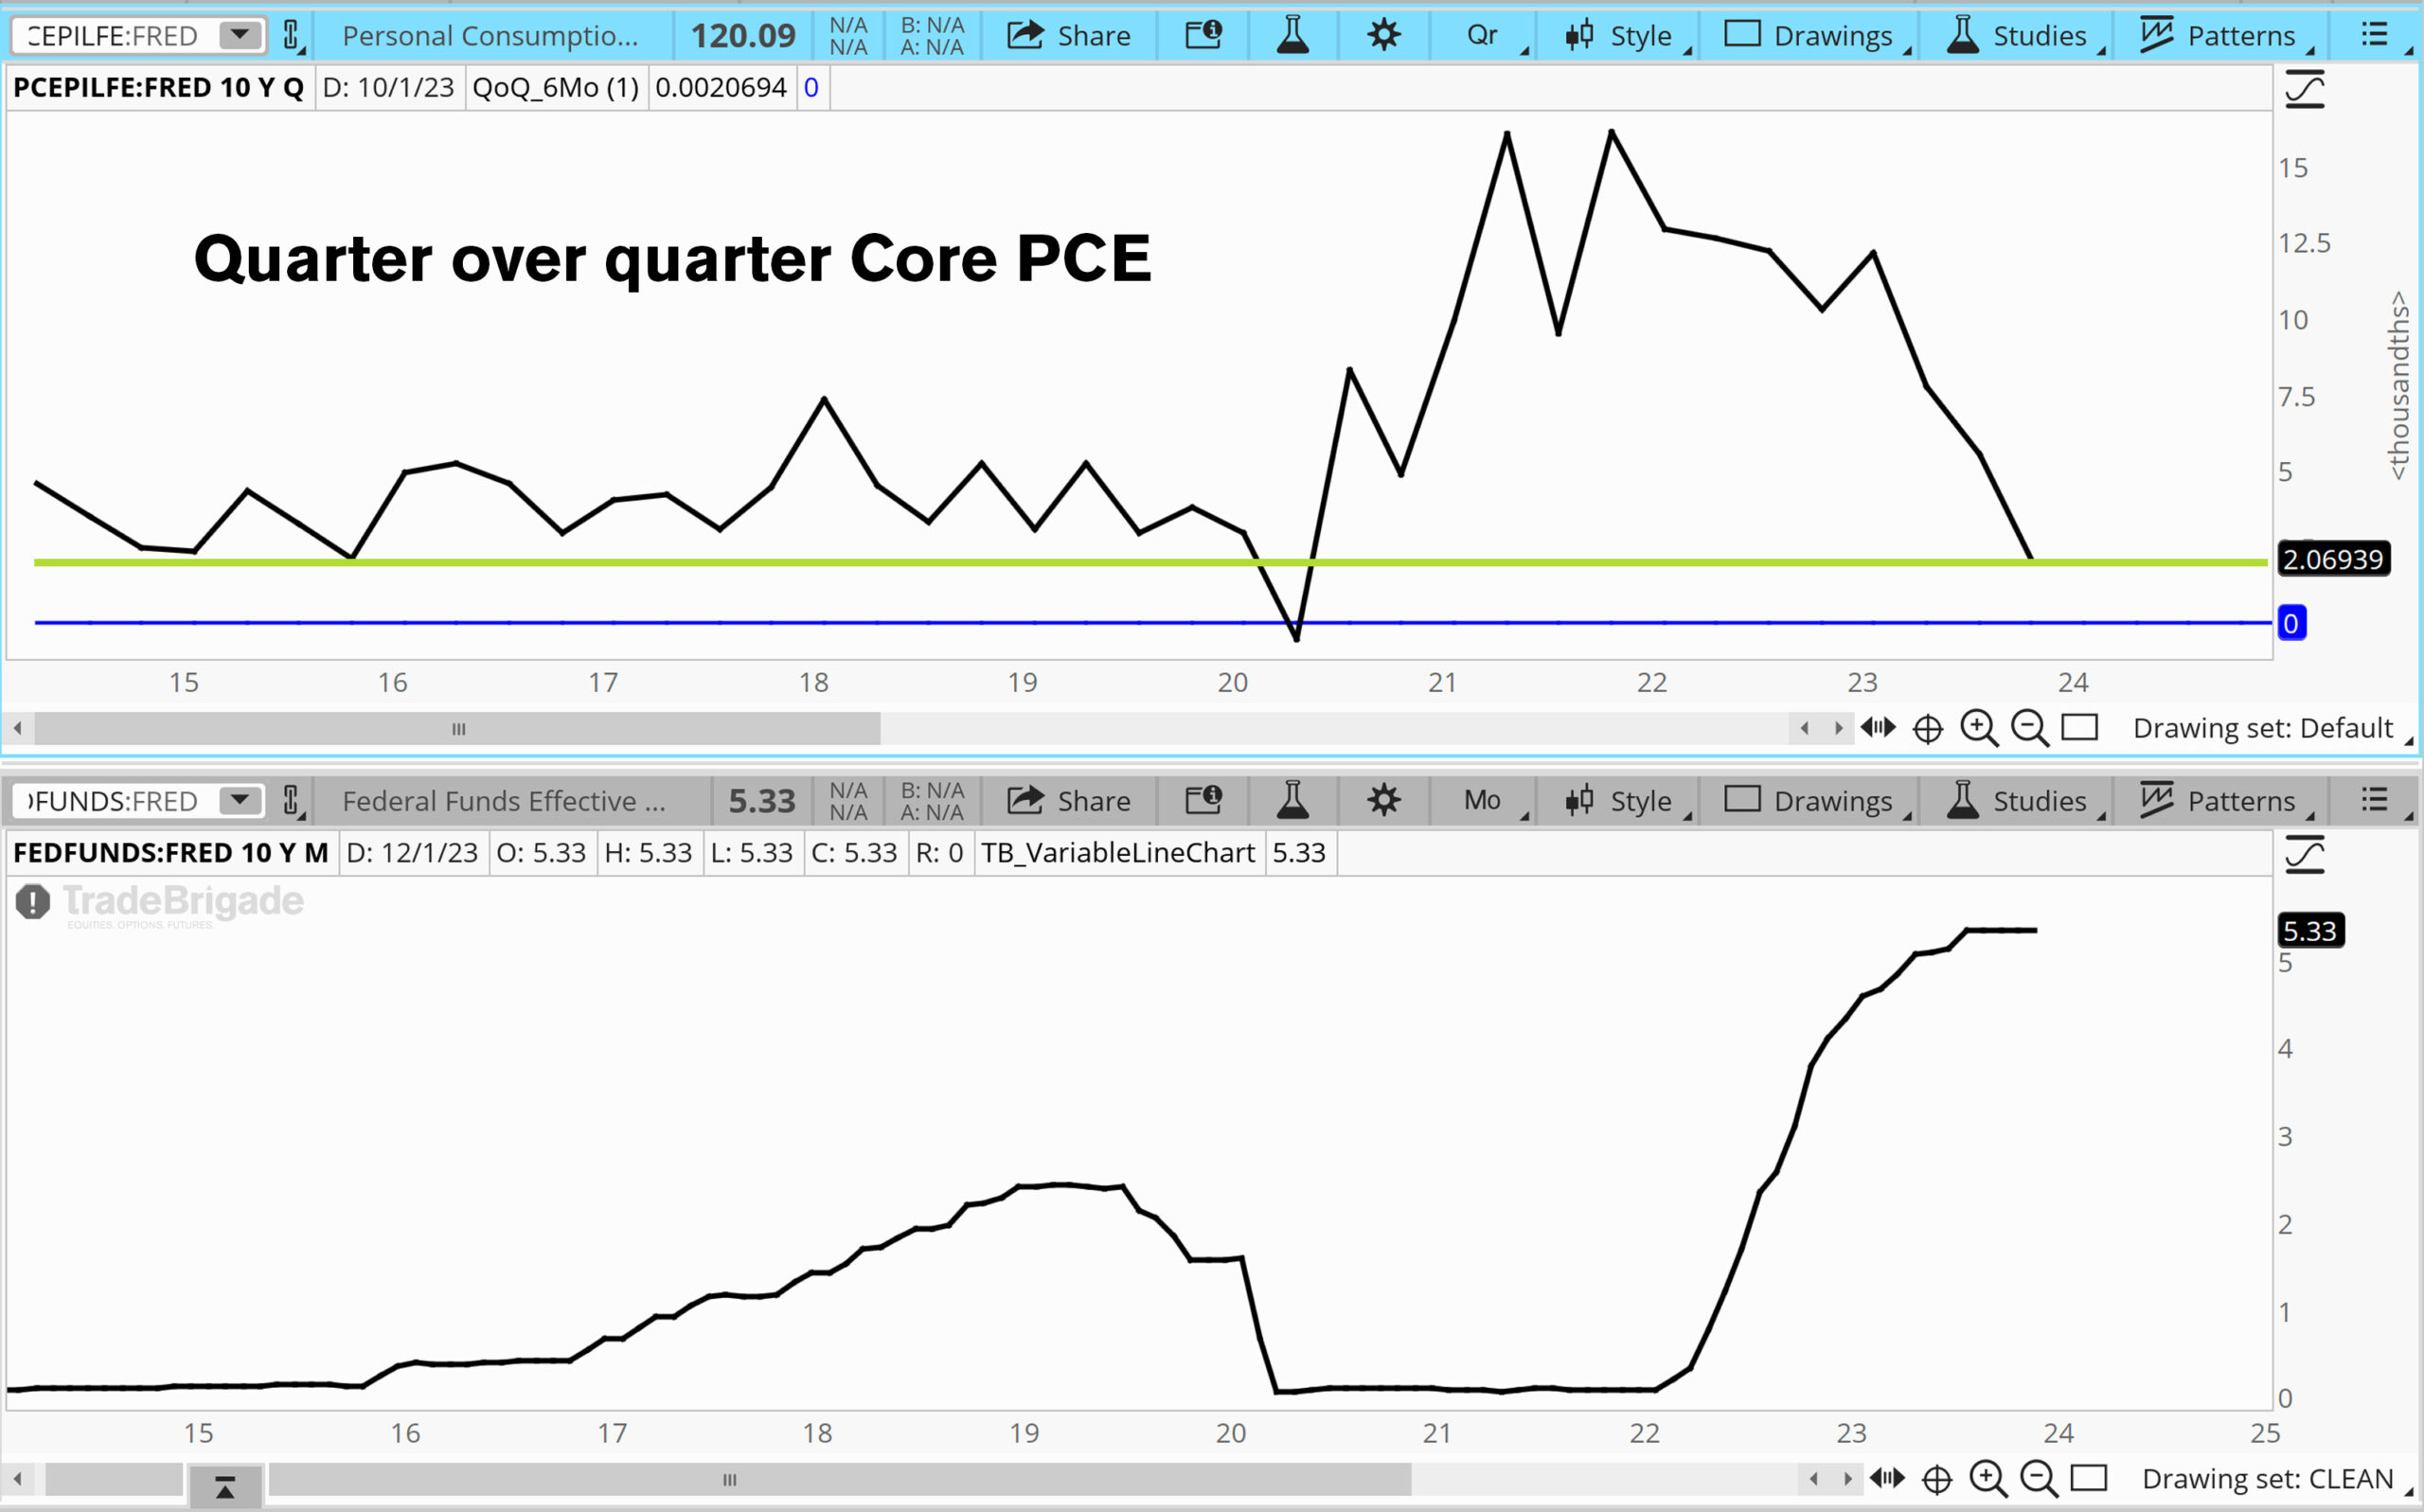
The story of 2022 was about inflation raging out of control and a Fed late to the party to tame it. “Transitory was transitory” as the talking heads joked, and rightfully so. In 2023, irrefutable progress was made, reflected in the Fed’s favorite metric core PCE; the most inspiring reading being the quarter-over-quarter measure at 2%. Additionally, over the last six months, the core PCE price index rose 1.9% at an annualized rate.
However, the job is not done, as the core PCE year-over-year reading is still high at 3.2% and the headline reads at 2.6%. Most of the volatile disinflation that has happened to the non-core read comes from energy. We expect this component to be volatile into the first half of 2024 as global tensions in the Middle East continue to linger. The more important metric for domestic inflation to continue to fall is services.
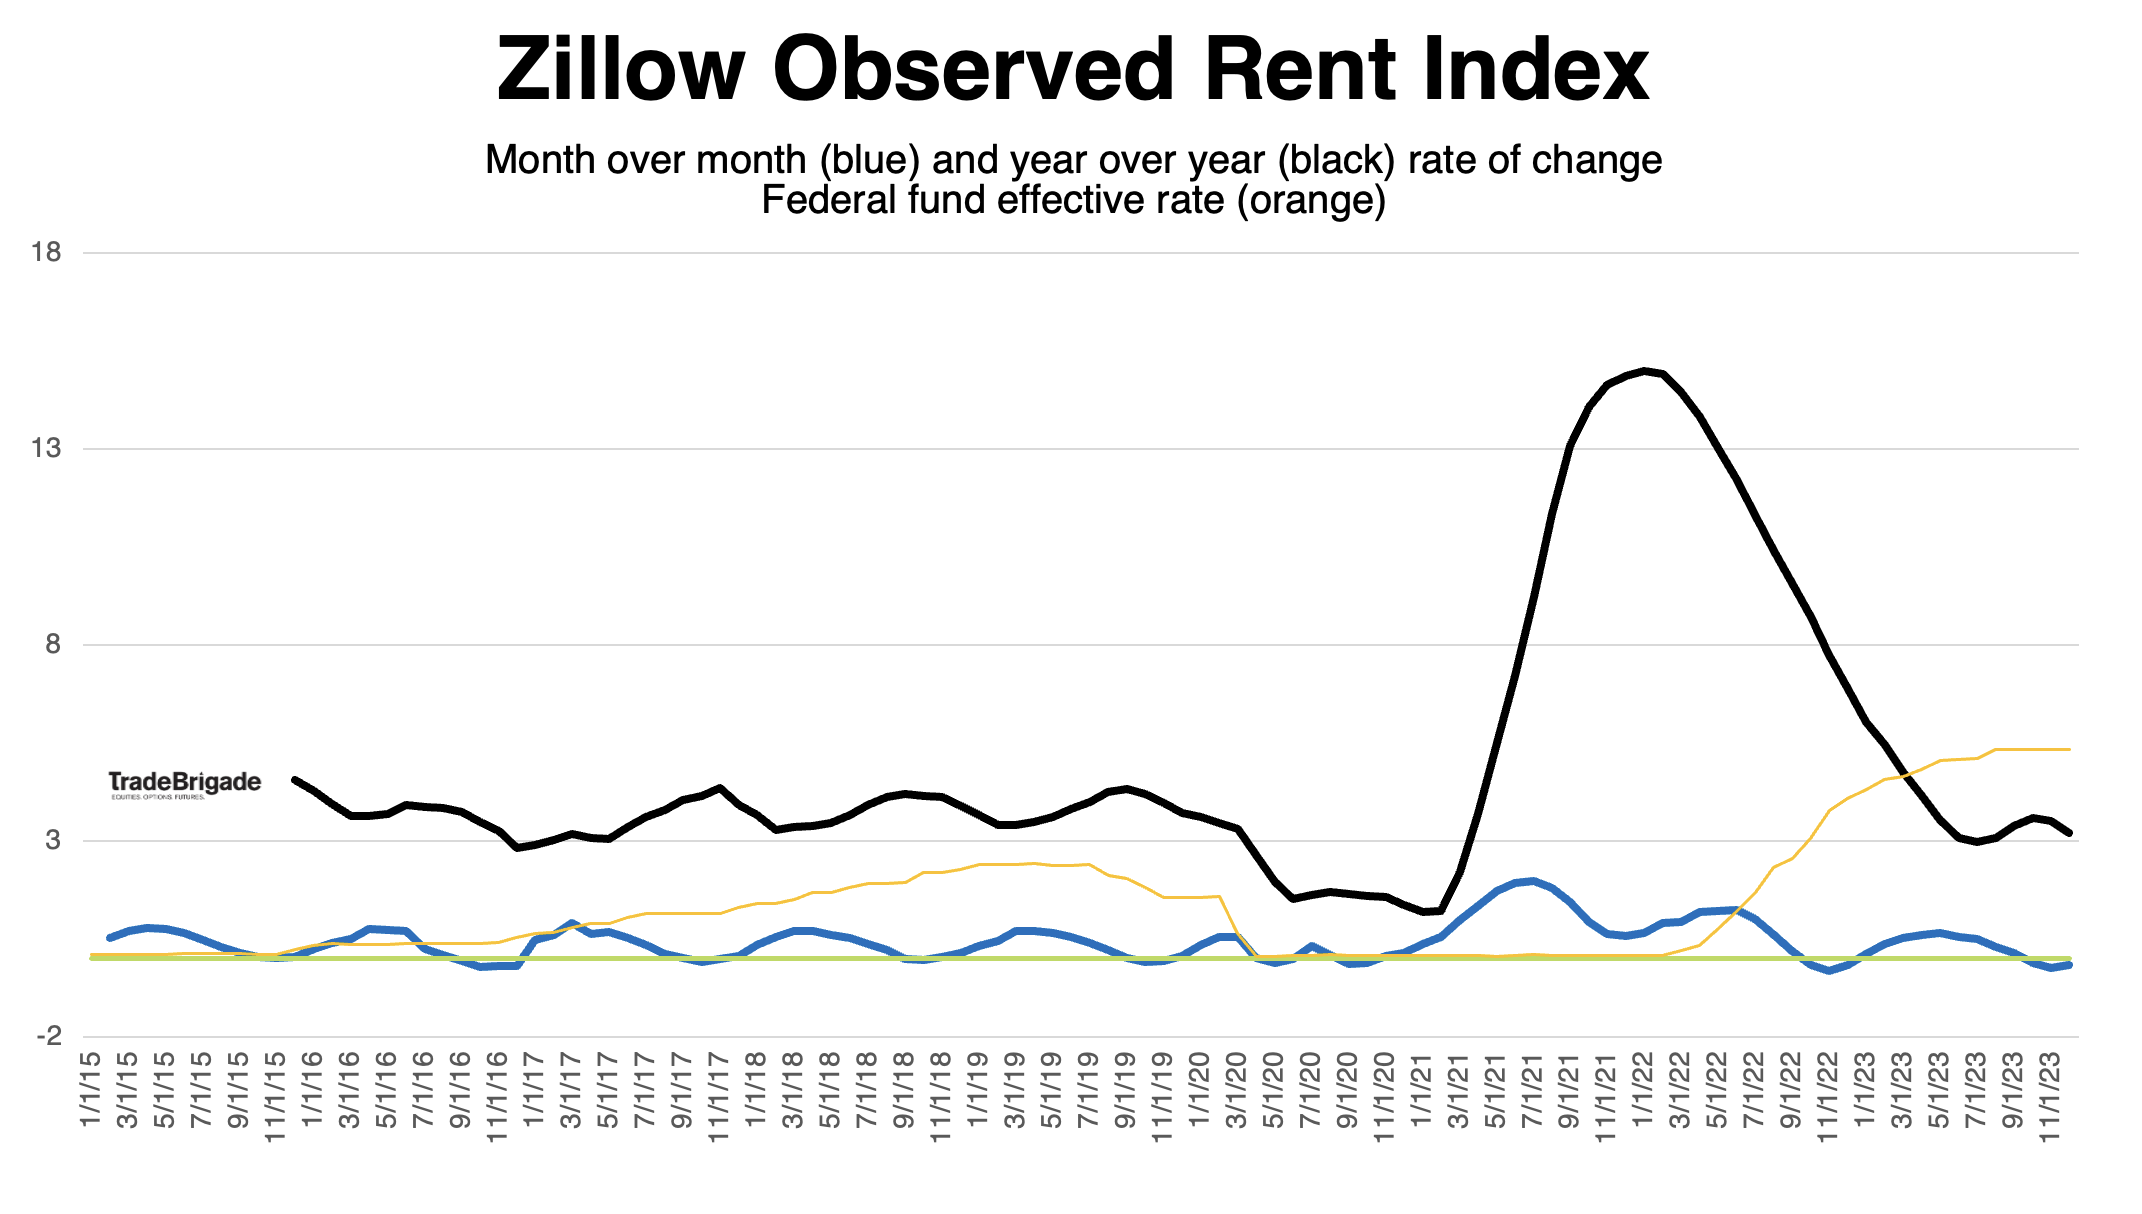
Because services are a stickier component of inflation, let’s investigate how that segment is responding to tighter monetary policy. We know that policy generally works with long and variable lags. Zillow’s rent database would suggest that the housing services and owners’ equivalent rent component of inflation will continue to trend lower or stabilize at historically accepted levels. With the Fed remaining higher for longer, our forecast would be lower, not stabilized. With the first cut priced for March 2024, continued disinflation seems like a higher probability outcome.
The Producer Price Index (PPI) remains negative on a year over year reading and will continue to put downward pressure on inflation readings. Producers notoriously pass on price increases to the consumer, and without higher input costs, prices should stabilize.

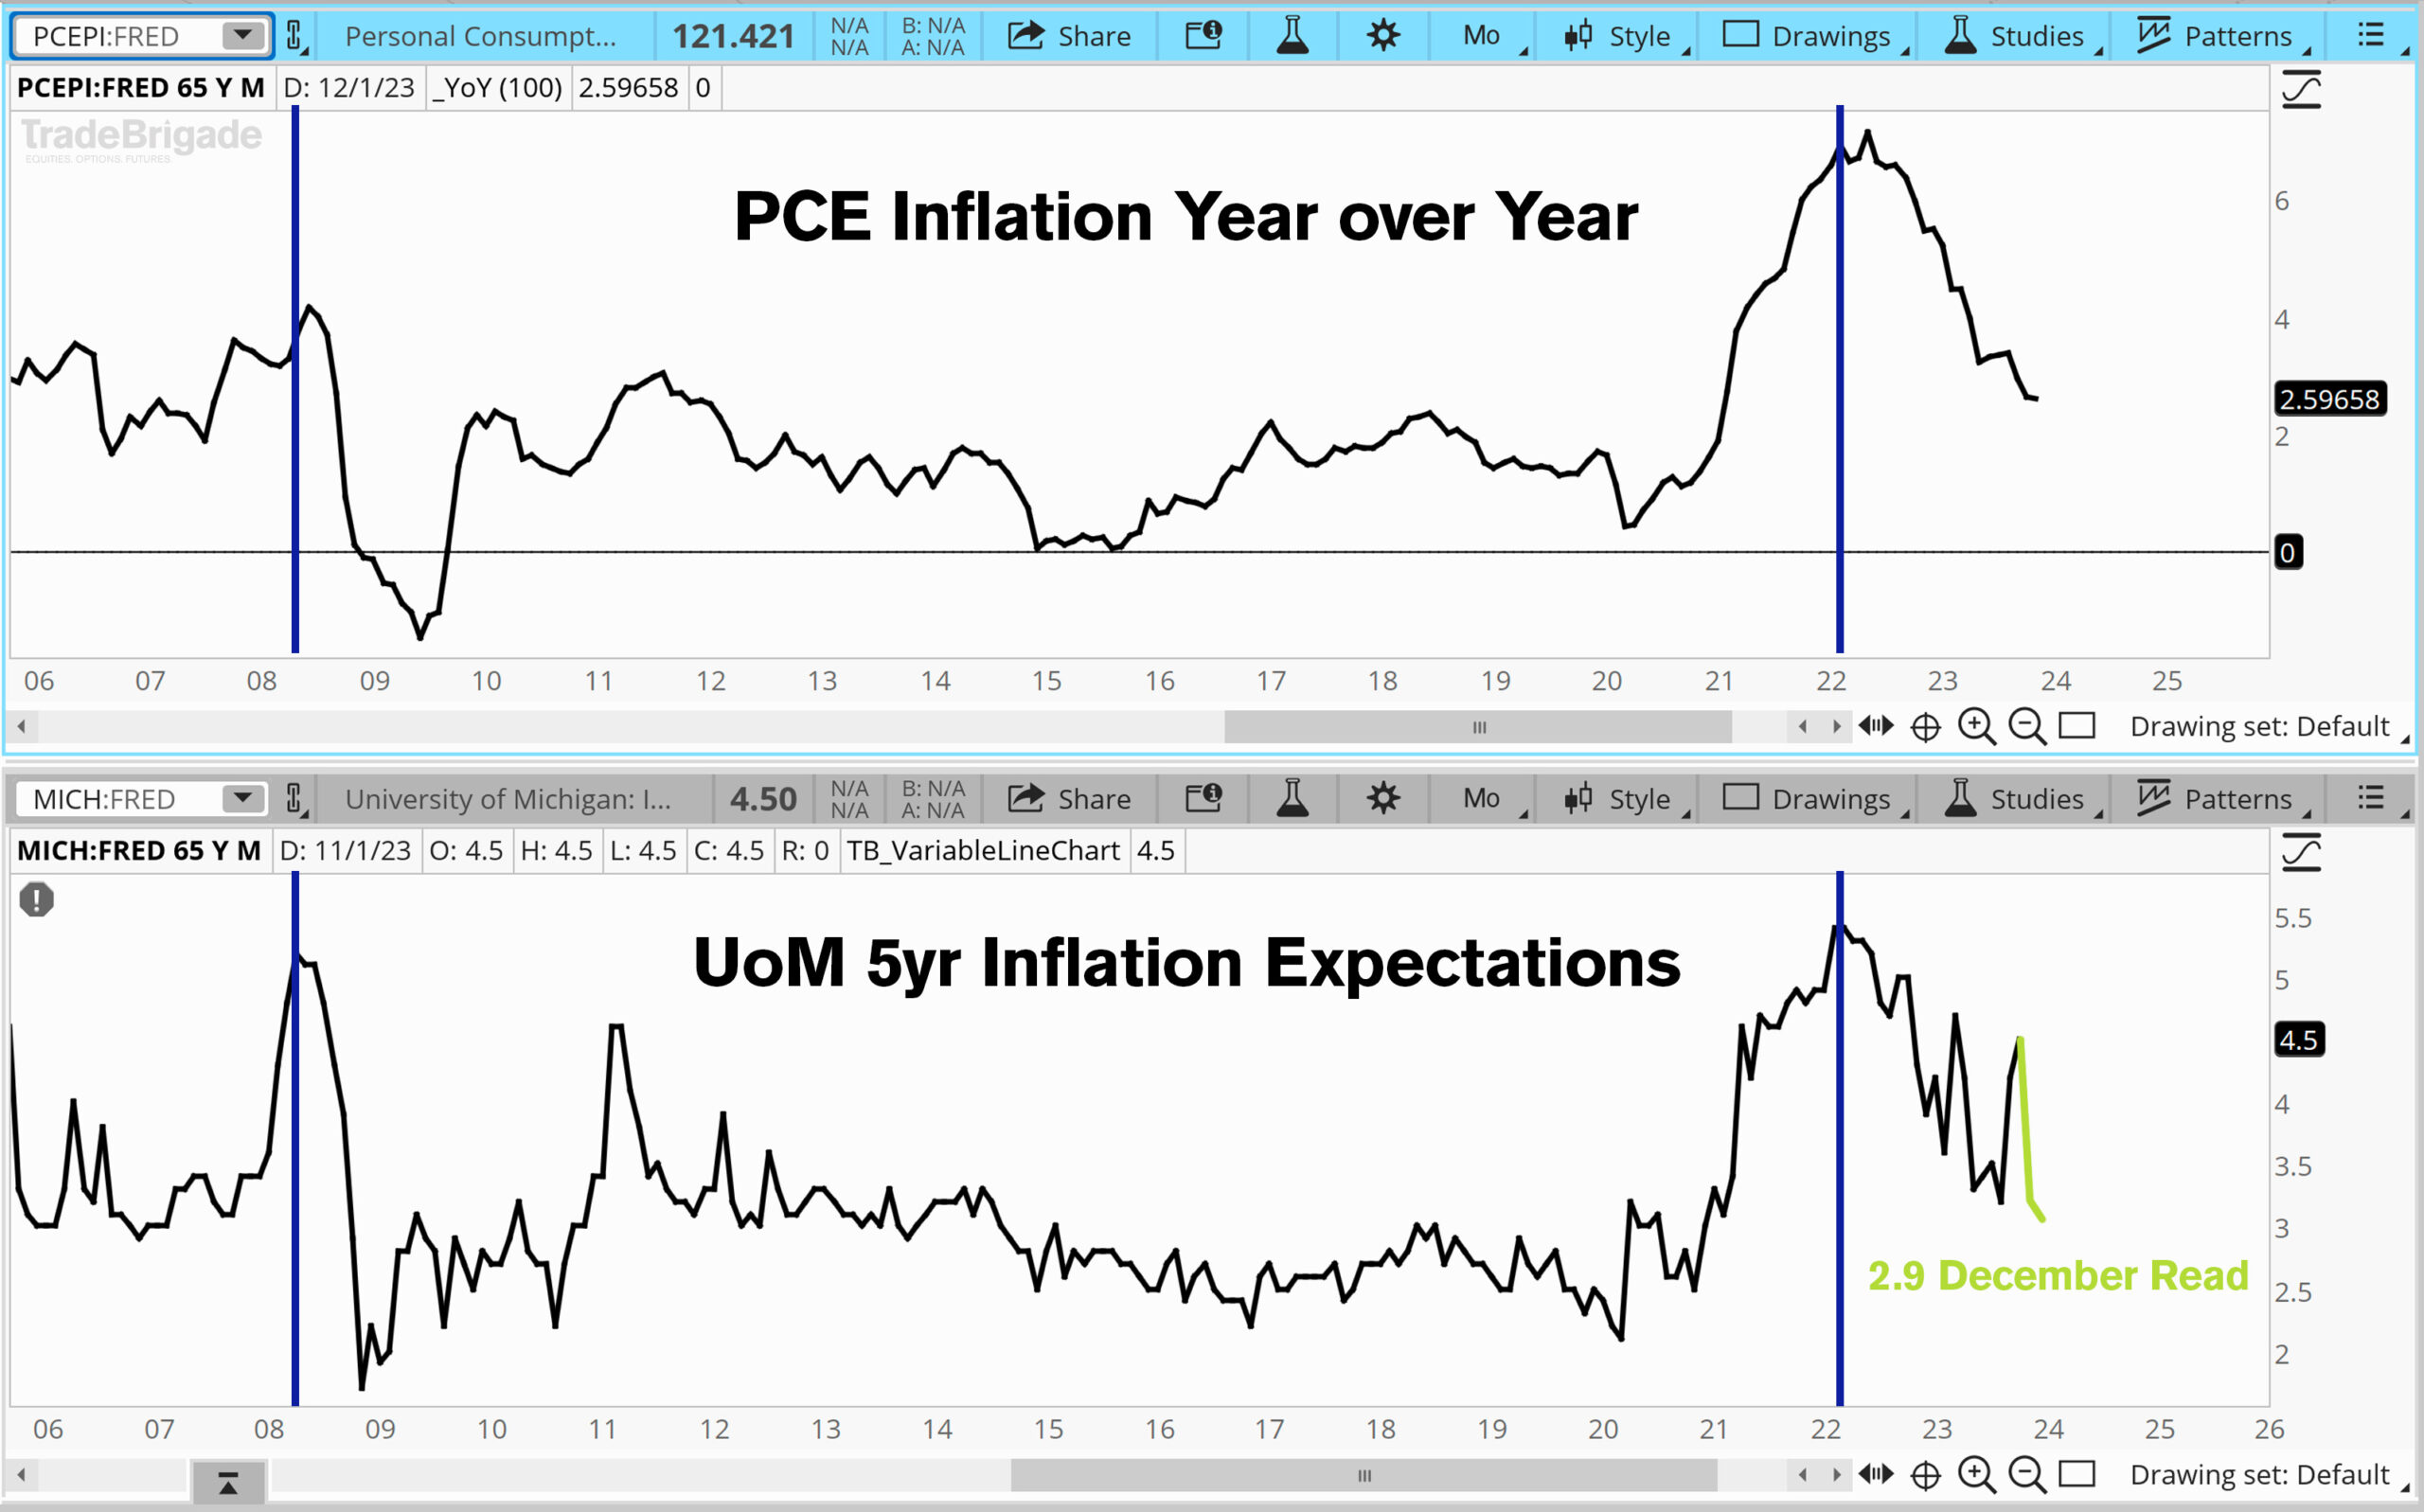
The psychology of inflation helps understand this phenomenon further. When expectations of inflation are high, begin to price them in before they happen. If the expectation is for three percent inflation, businesses will price in three percent of increased input cost and pass that along to their consumers. Consumers will want a larger raise at work to compensate for reduced purchasing power. The Fed’s study of this phenomenon revealed that expectations have a larger impact on long run inflation, not short run. If expectations rose by one percent, inflation rose roughly one percent all else equal (The Relationship Between Inflation and Inflation Expectations).
In the figure below, note how inflation expectations topped before PCE inflation in 2008 as well as 2022. Our current read is volatile, but it continues to trend in the downward direction, suggesting continued support of disinflation.
Avoiding Deflation
It’s important to note that we aren’t expecting things to get cheaper as inflation subsides. We are expecting the rate at which prices rise to slow. The risk of deflation is a spiral where consumers are no longer incentivized to spend their dollars today because they will likely hold more purchasing power in the future.
This results in a hit to corporate earnings, and a vicious negative feedback loop that is difficult to break without Fed intervention. When earnings are down, unemployment tends to rise, and consumers are left with no choice but to reduce spending. As a result, companies continue to see earnings fall and we repeat the sequence until the Fed spurs growth by lowering rates. This panic response is typically why the first rate cut is deemed bearish. It’s a response to horrific economic conditions.
So deflation aside, the Fed is currently tasked with balancing inflation and labor market risks more equally. In the latest meeting minutes, the committee acknowledged that the risks have shifted from being primarily price stability to a combination now of the two. Successfully accomplishing both components of the dual mandate would result in the Goldilocks scenario people refer to as a soft landing.
In light of the policy restraint in place, along with more favorable data on inflation, participants generally viewed risks to inflation and employment as moving toward greater balance. However, participants remained highly attentive to inflation risks.
– FOMC Meeting Minutes December 2023
Labor market
So far Jerome Powell has done the unthinkable. The fastest tightening cycle in modern history has not produced adverse reactions in the labor market. We continue to see historically low unemployment despite anecdotal evidence of some layoff waves from large tech firms early in 2023. The biggest predictor of a recession is the unemployment rate. If people still have jobs, spending will continue and corporate earnings have a chance to grow.
The Sahm Rule is one of the best predictors of a recession and is directly tied to the unemployment rate. The rule states when the three-month moving average of the national unemployment rate rises by 50 basis points or more relative to its low during the previous 12 months, a recession is likely to occur.

Blackrock argues in their 2024 outlook report that the jobs numbers are actually misleading and are below pre pre-pandemic trend. The main thesis is that we see historically low unemployment rates because there is a worker shortage, not because the labor market is robust.
The level of employment is well below the track we would have expected to be on before the pandemic…the U.S. economy has grown by less than 1.8% a year, on average, since the pandemic. That’s well below the trend we would have expected pre-pandemic – and well below where the consensus and Federal Reserve had expected. That’s nothing to be excited about

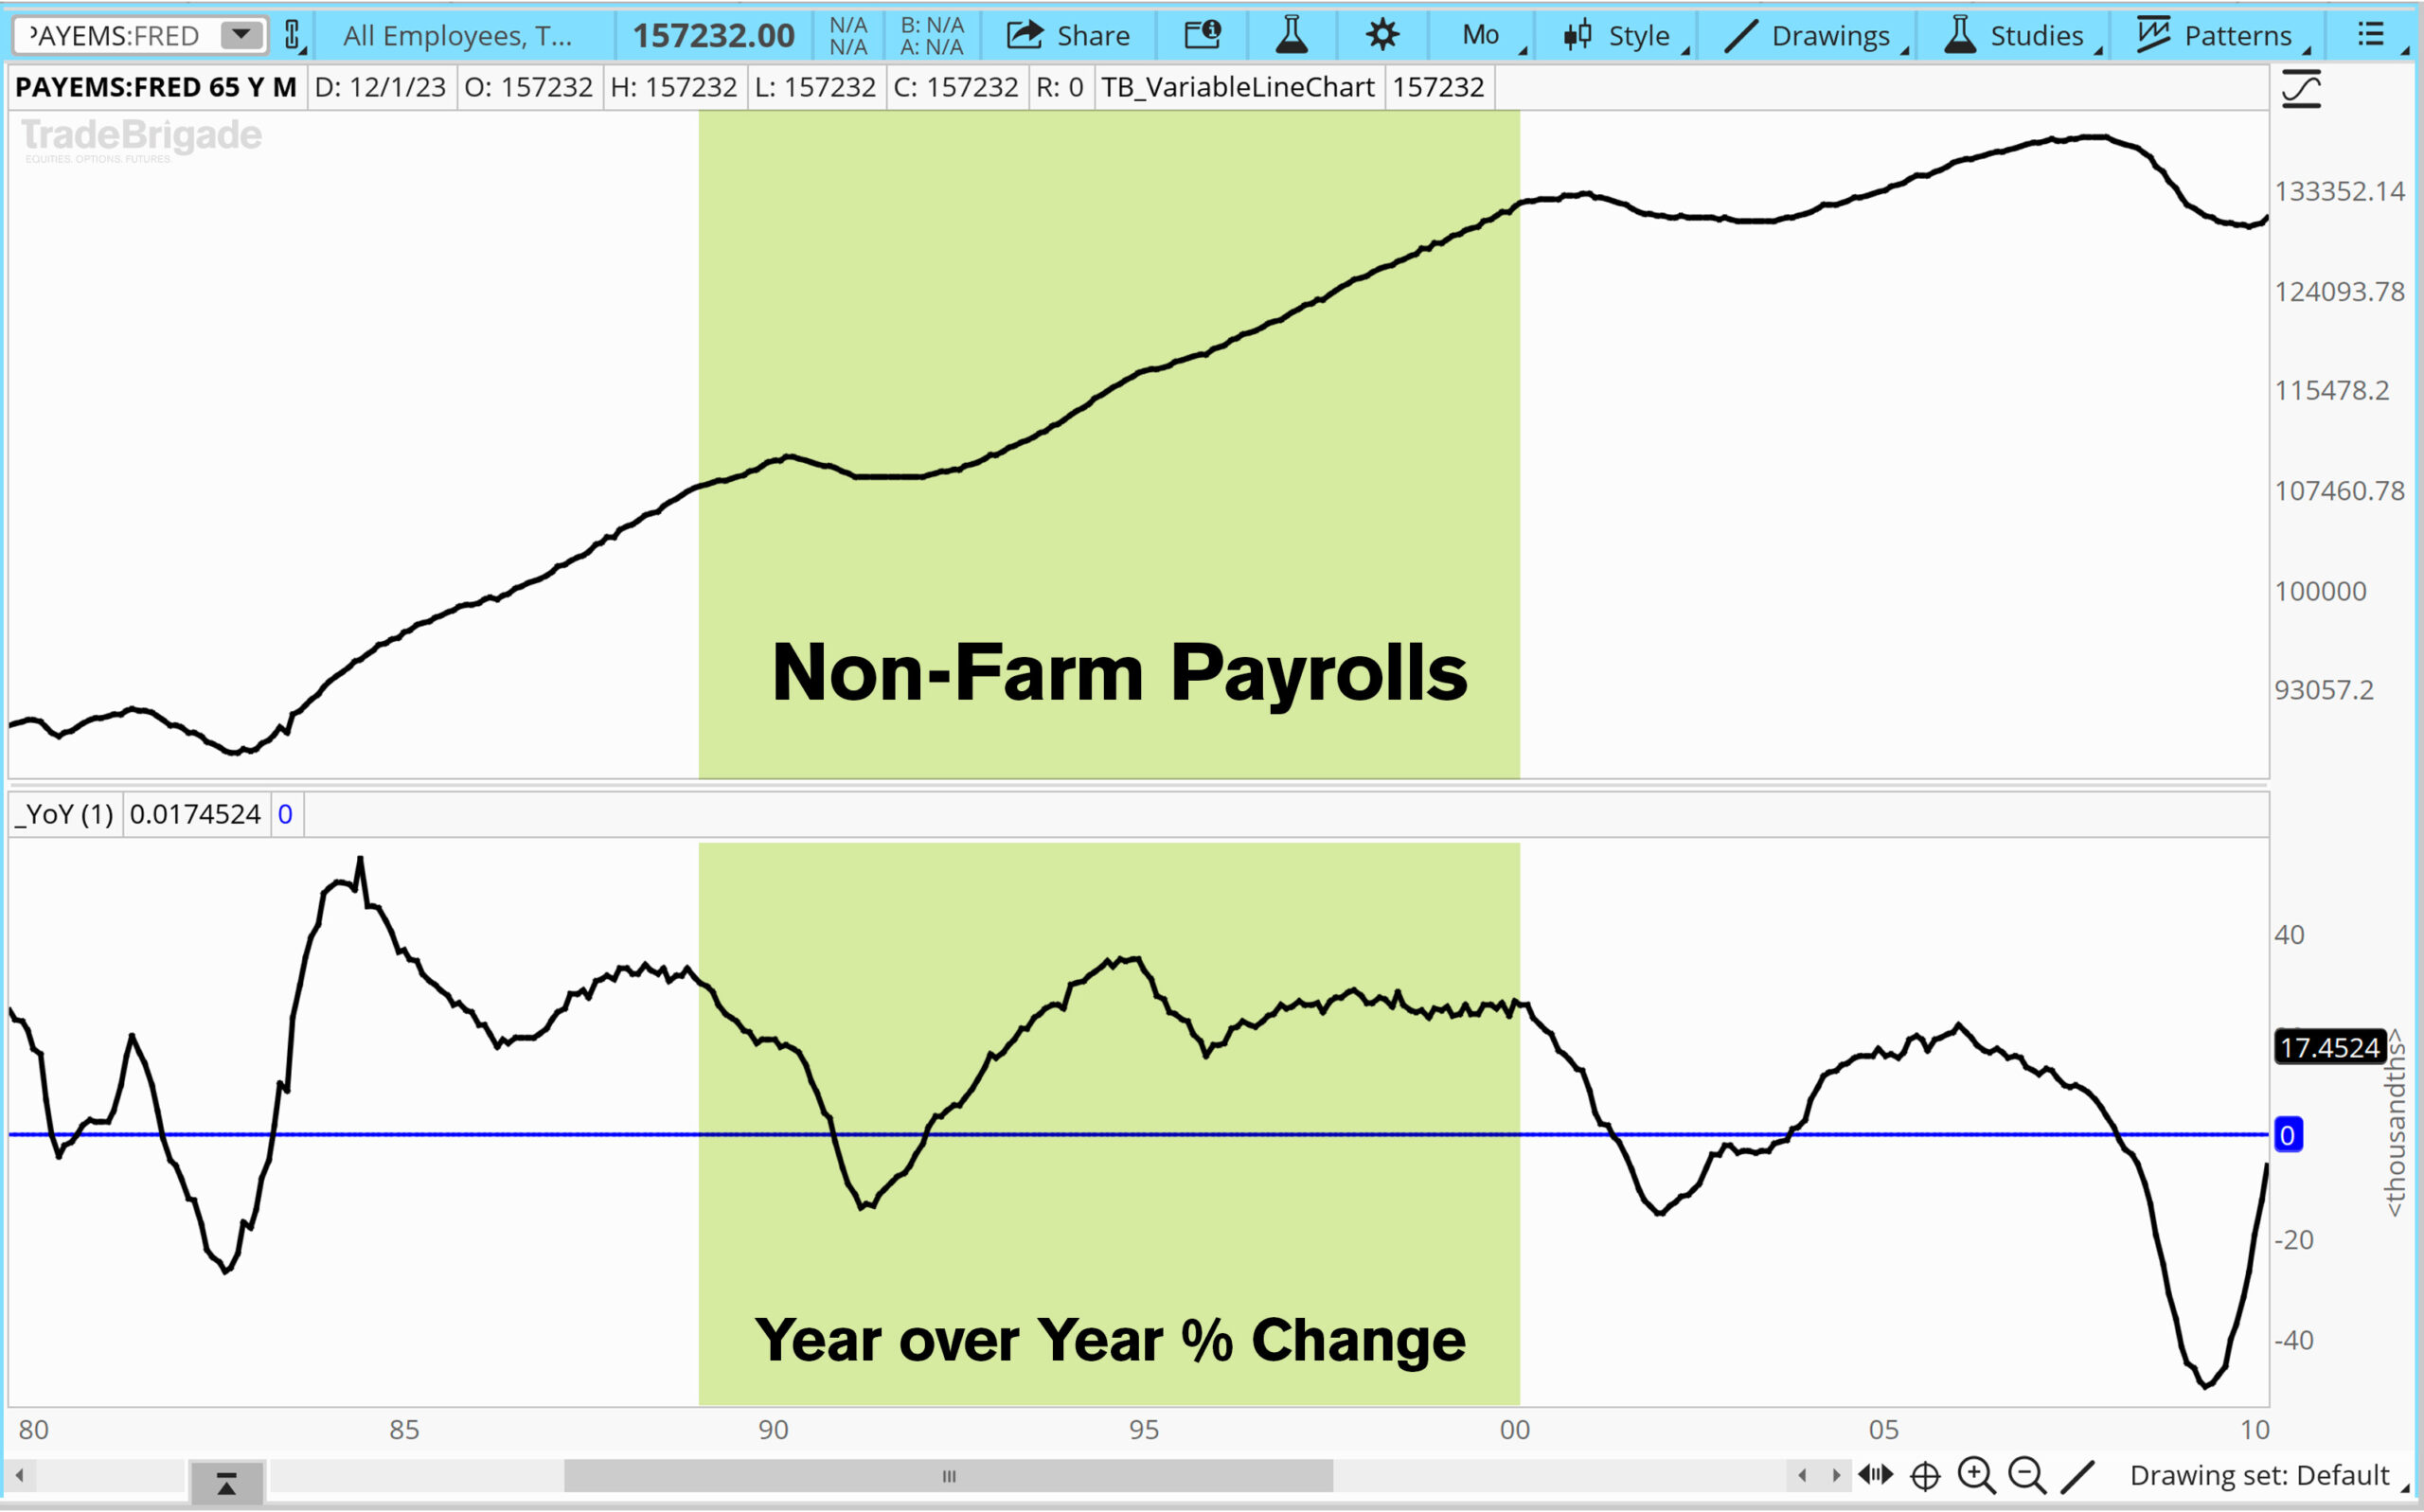
And while yes, the non-farm payrolls would suggest that we are below pre pre-pandemic trend, we do not foresee this as a lasting weakness in the economy for two reasons. Firstly, the year-over-year rate of change is still above the pre-pandemic trend. Secondly, the demographic landscape suggests a new surge of participants about to enter the labor force. Make note of the timeframe between 1989 and 2000. This will tie directly into our next section.
Demographics
An additional layer that can help us understand the trends in the labor market is knowing exactly what types of participants we have. Demographic trends can help us make sense of where productivity and employment may be headed in the medium to long-term outlook, suggesting that Blackrock’s assumptions may be too nearsighted.
| Generation Name | Birth Year Range | Age Range | Population (Statista) |
| Baby Boomers | 1946–1964 | 58–76 years old | 68.59 M |
| Generation X | 1965–1980 | 42–57 years old | 65.37 M |
| Millennials | 1981–1996 | 26–41 years old | 72.24 M |
| Generation Z | 1997–2012 | 10–25 years old | 69.58 M |
| Generation Alpha | 2013–present | 0–9 years old | 38.55 M |
Currently, demographics look like a tailwind not a headwind for the market. An analysis of our generational cohorts reveals the opportunity for continued economic expansion from the Millennials and Gen Z. They are quickly overtaking the fading Boomer generation in terms of workplace productivity.
We focus on the Boomer generation because they currently hold more than 50% of the wealth in the United States (Statista). Generation X will be a small tailwind to Boomers, but the next largest working cohort is the Millennials.

Between 1989 and 2000 the youngest Boomers were 25 years old and the oldest Boomers were 54 years old.
The Boomers were once thought of as the largest and most influential generation in the economy. The figure below illustrates that when boomers were in their prime working years, the market had returned an impressive 377%. Now, the boomers have been overtaken by the Millennials who are 3.5M+ larger in population. Gen Z, who isn’t quite as prominent in the workforce yet, is about 1M+ larger in population than the Boomer generation as well. (Statista)
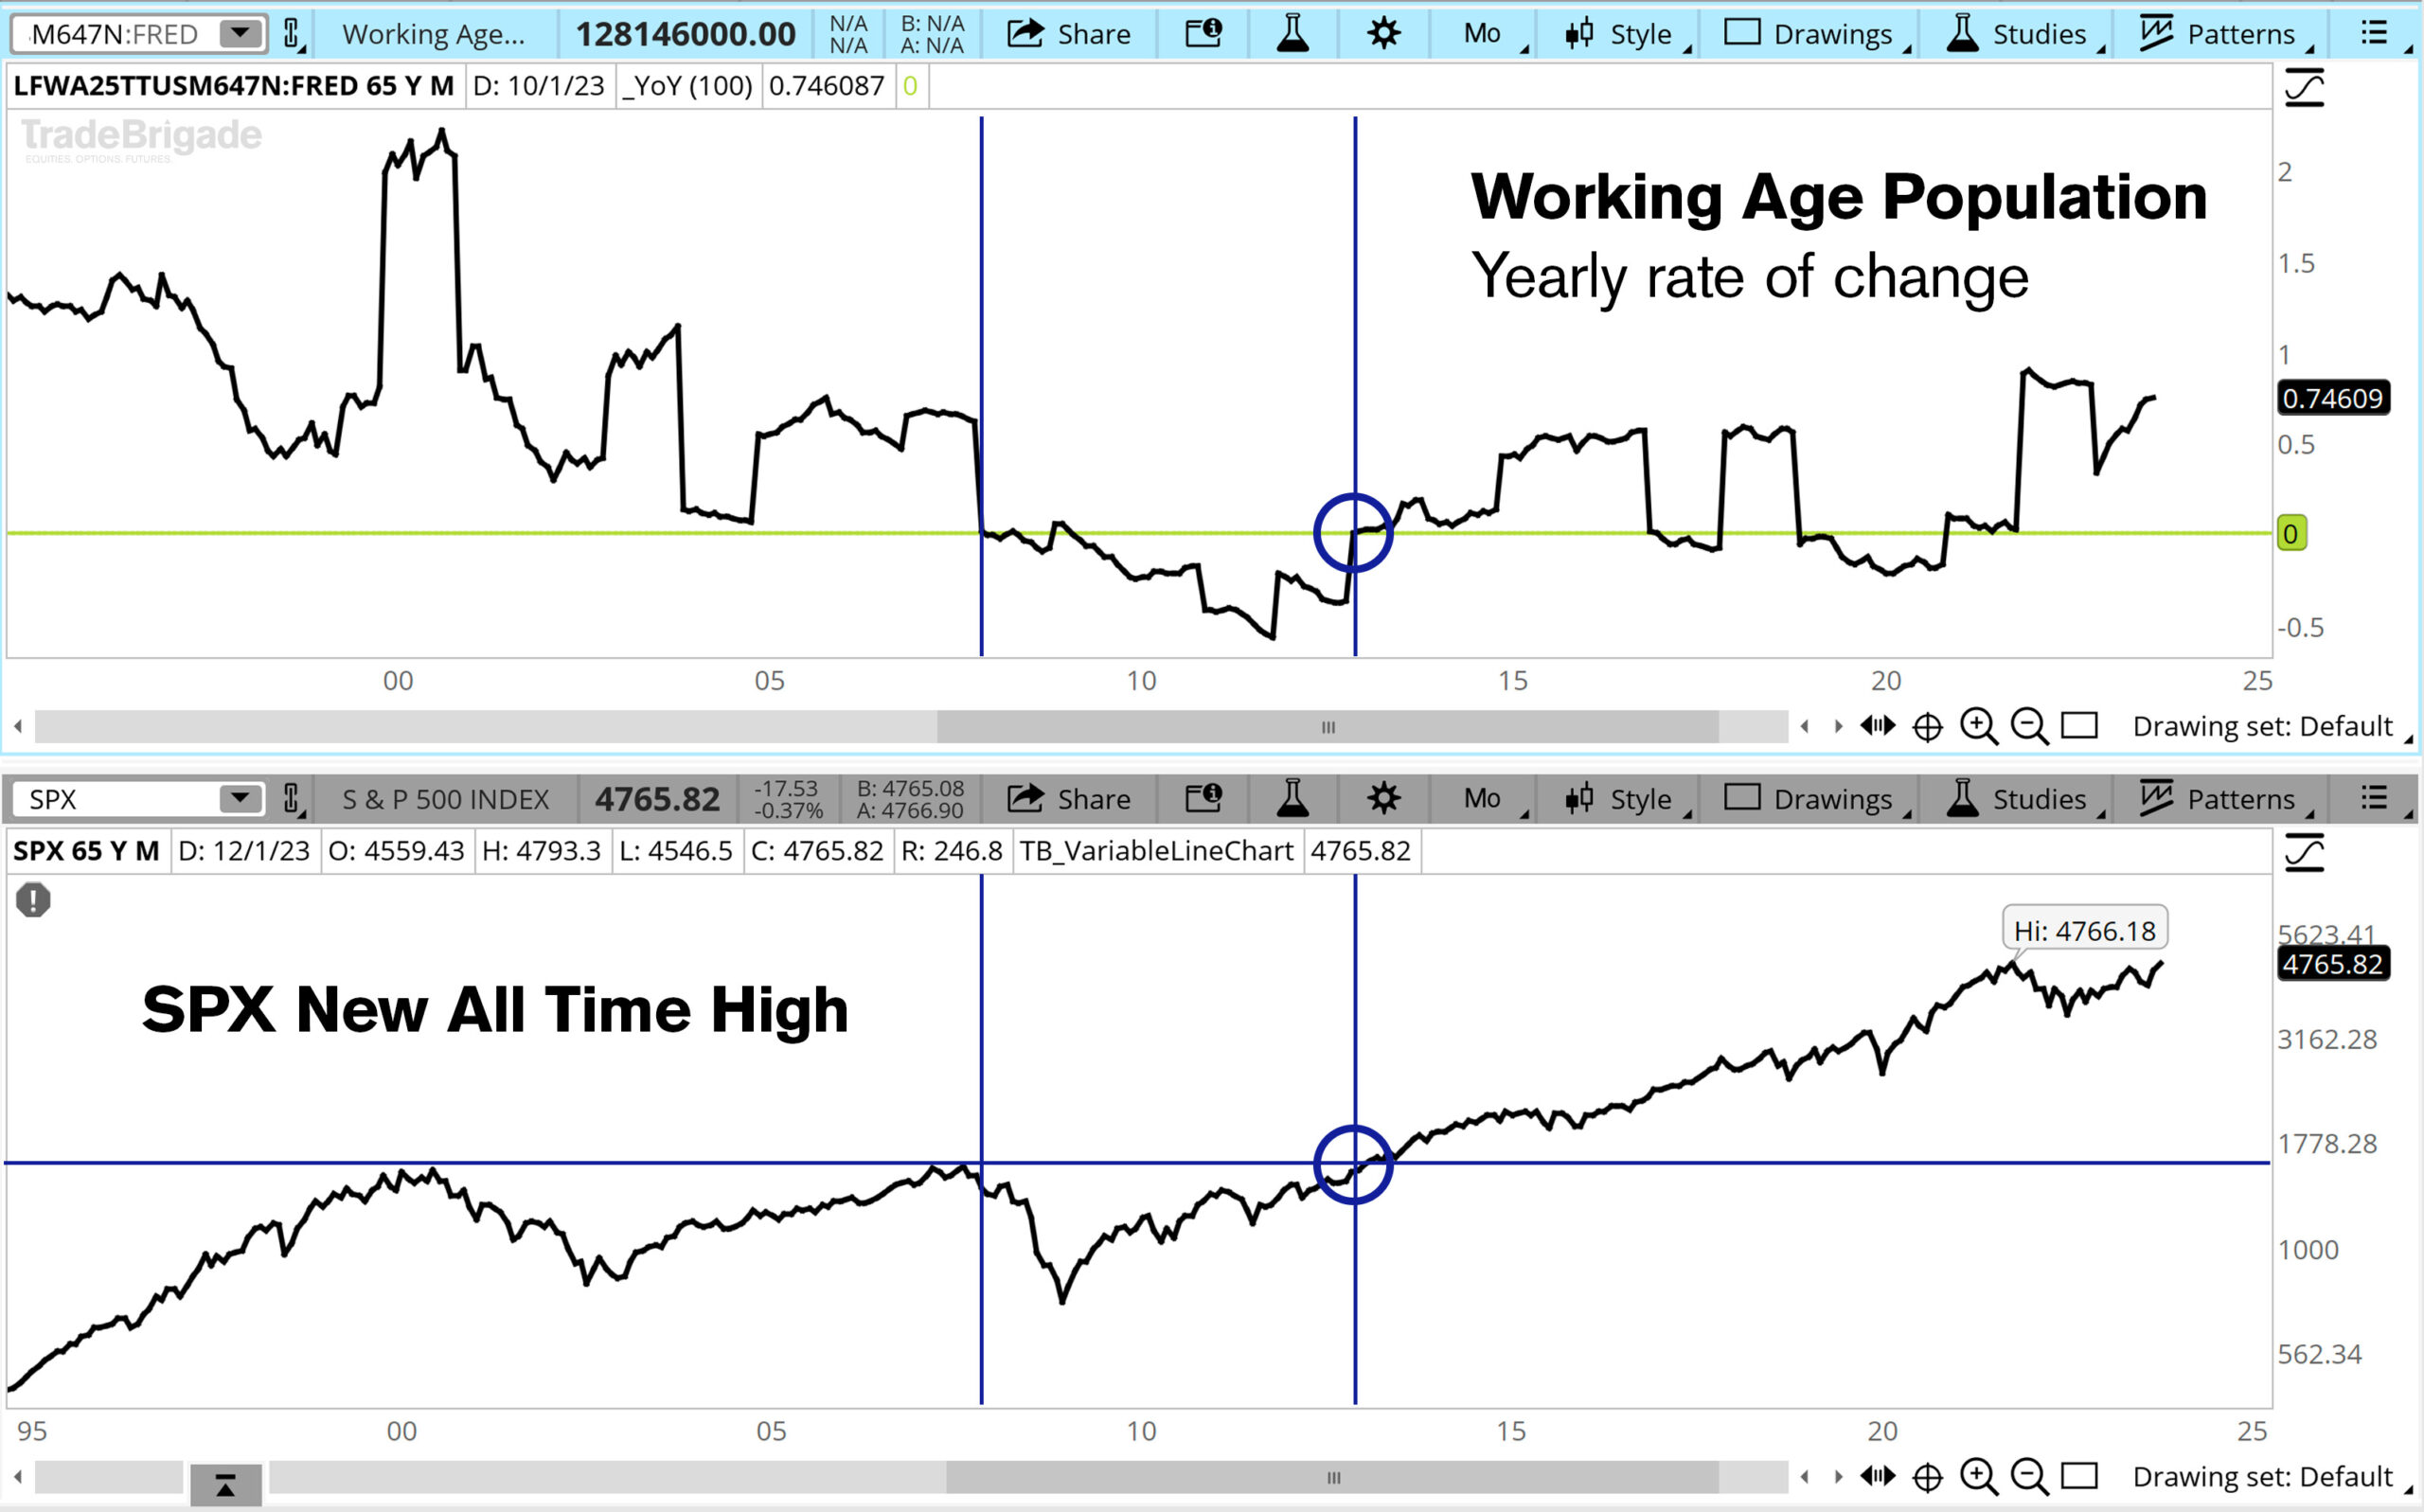
The Bureau of Labor Statistics (BLS) defines the prime working age for the US population as being between 25 and 54. This cohort is trending in the upward direction compared to the downward direction, suggestive of more workplace productivity in the coming years. Boomers will phase out of this demographic, but be replaced by the larger Millennial cohort, soon followed Gen Z cohort.
In the figure below, notice how when the yearly rate of change in the working age cohort flips from negative to positive after the great financial crisis, the market is able to surpass the previous highs and continue to trend higher for quite some time.
This is indicative of strong economic production being priced into corporate earnings, bolstered by a productive workforce that is expanding not contracting. The current trend of the prime working-age population is higher which aligns with the idea that Boomers will certainly fade out of the cohort, but promptly be replaced by two larger generations.
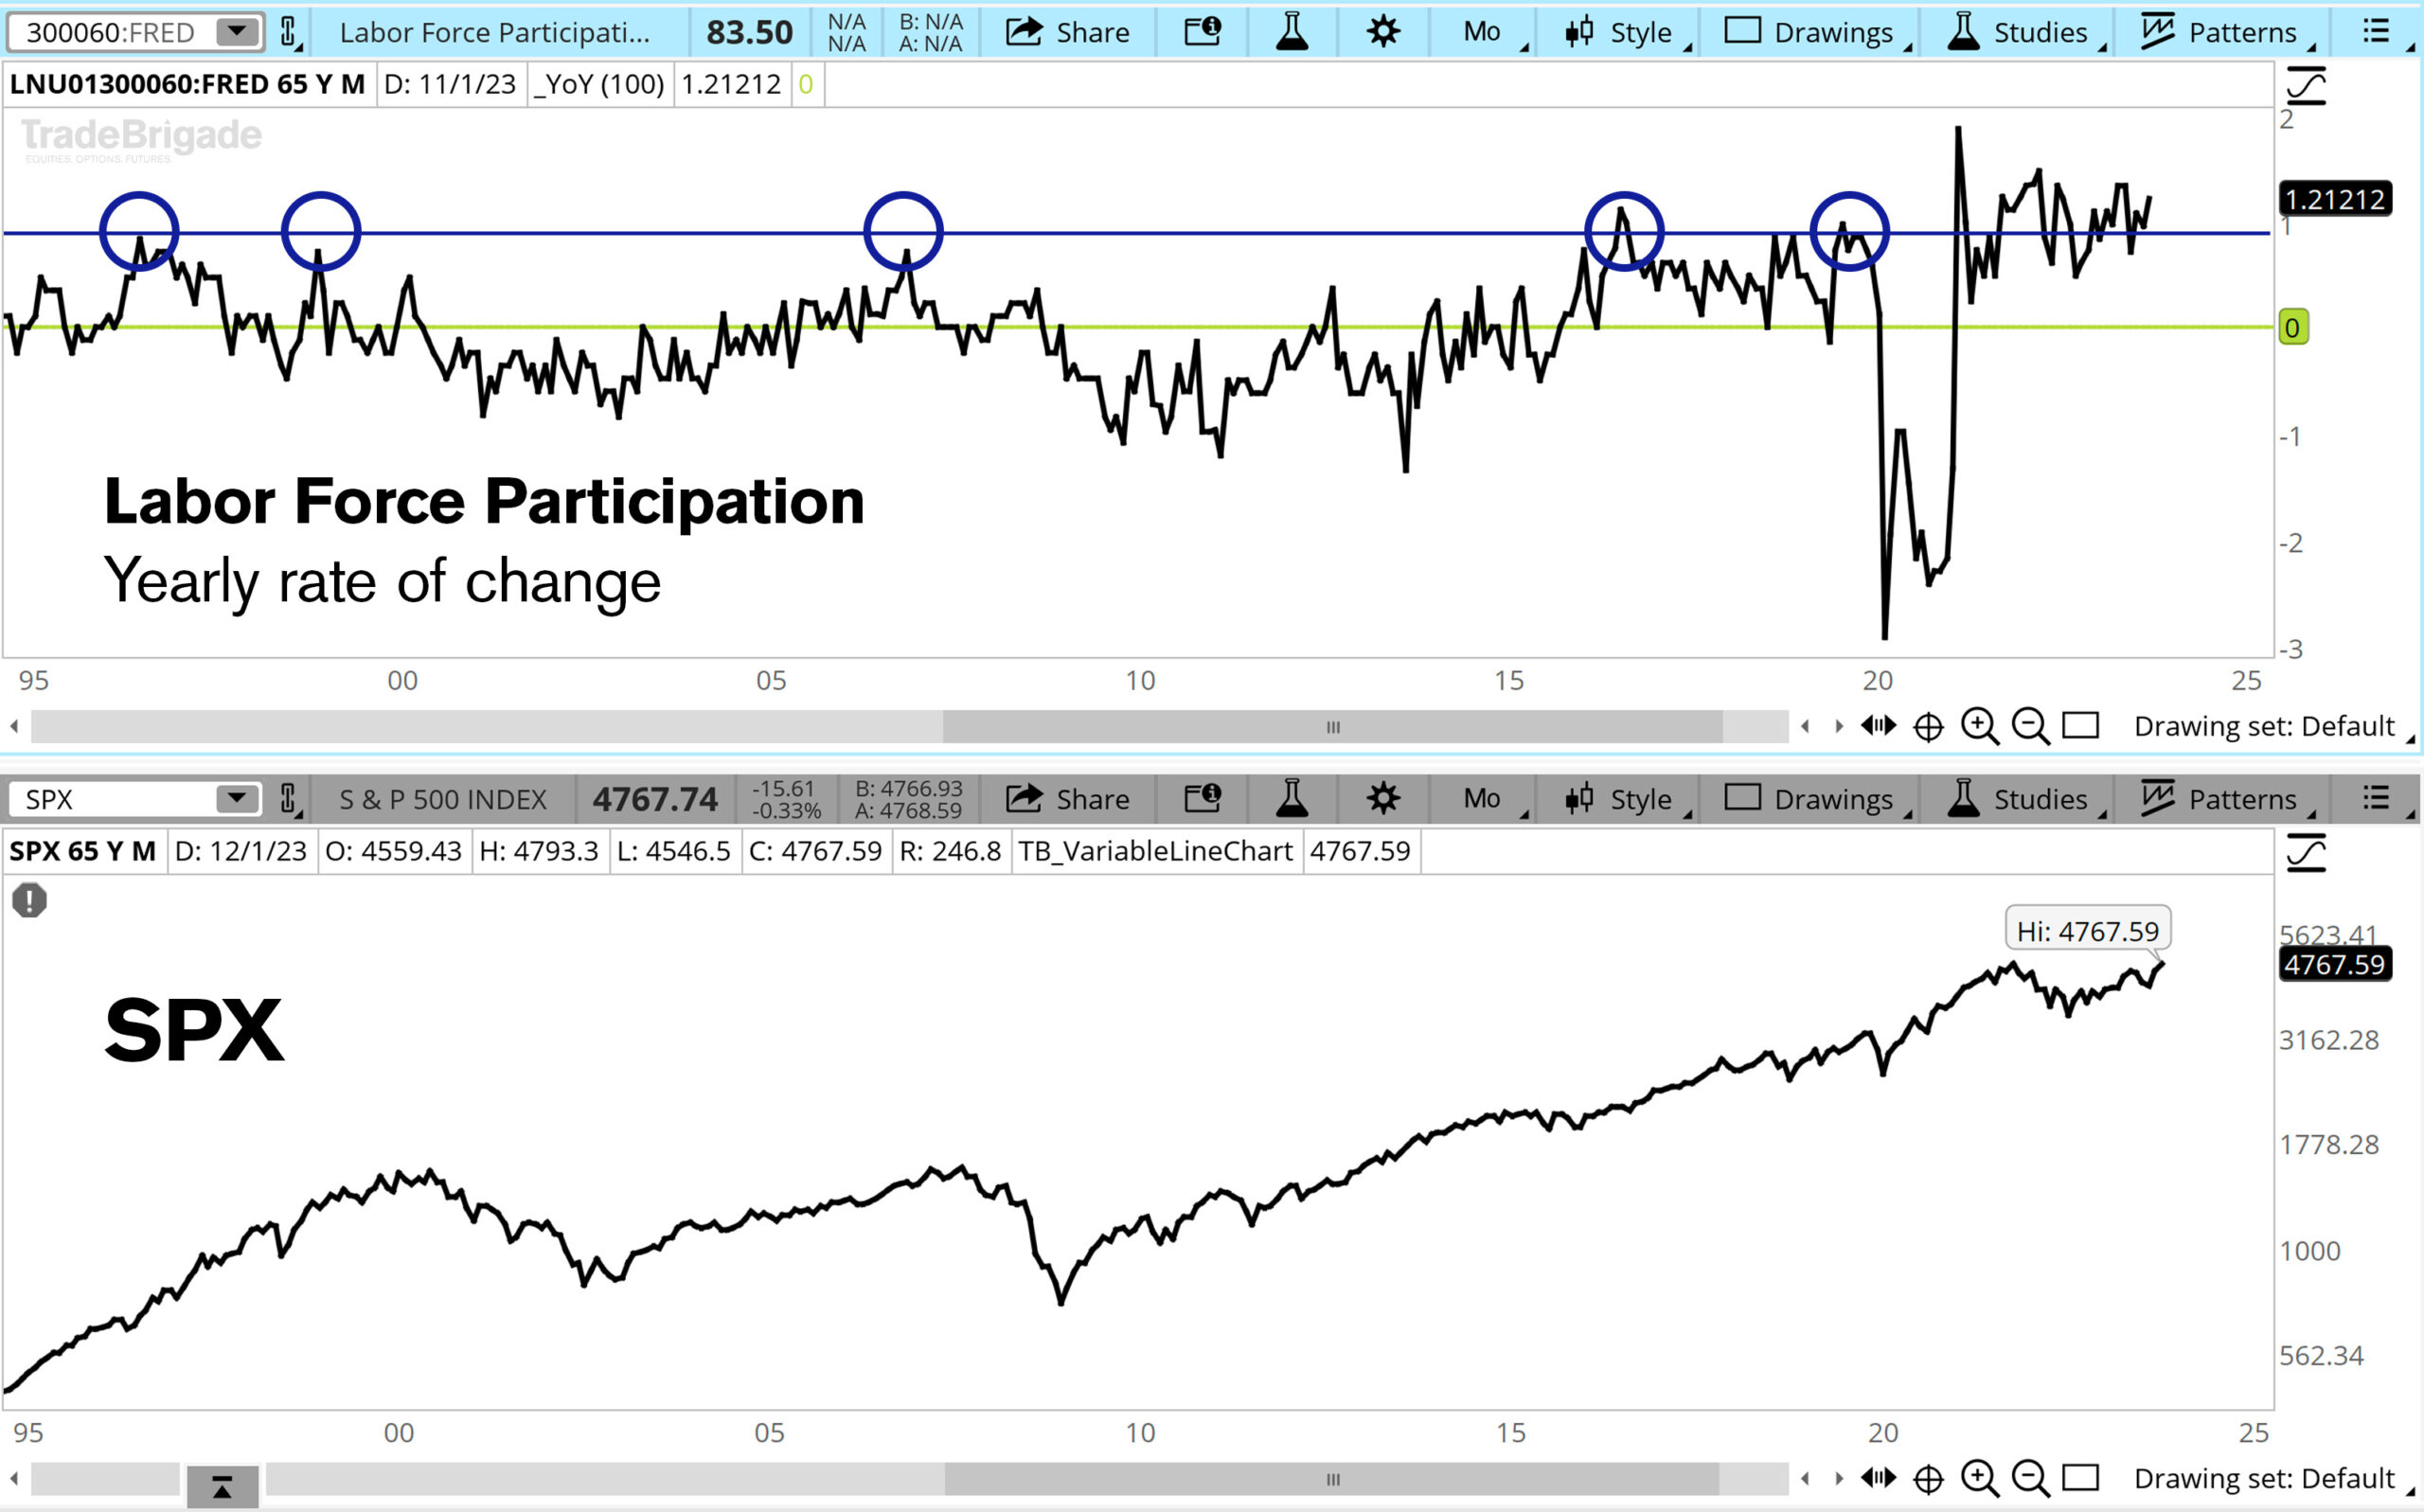
The prime population growth is important, but it means nothing if those in the cohort elect not to participate in the labor force. This is easily debunked by the below figure, suggesting that labor force participation has rebounded sharply after the drop off as a result of COVID. The year over year change is the highest we have seen in decades.
So just like the Boomers had their window of economic expansion and saw S&P market returns around 377%, the Millennials will have their window between 2021 and 2035. If there is a comparable return profile of ~377% from the S&P 500 we have a measured move towards 17475.
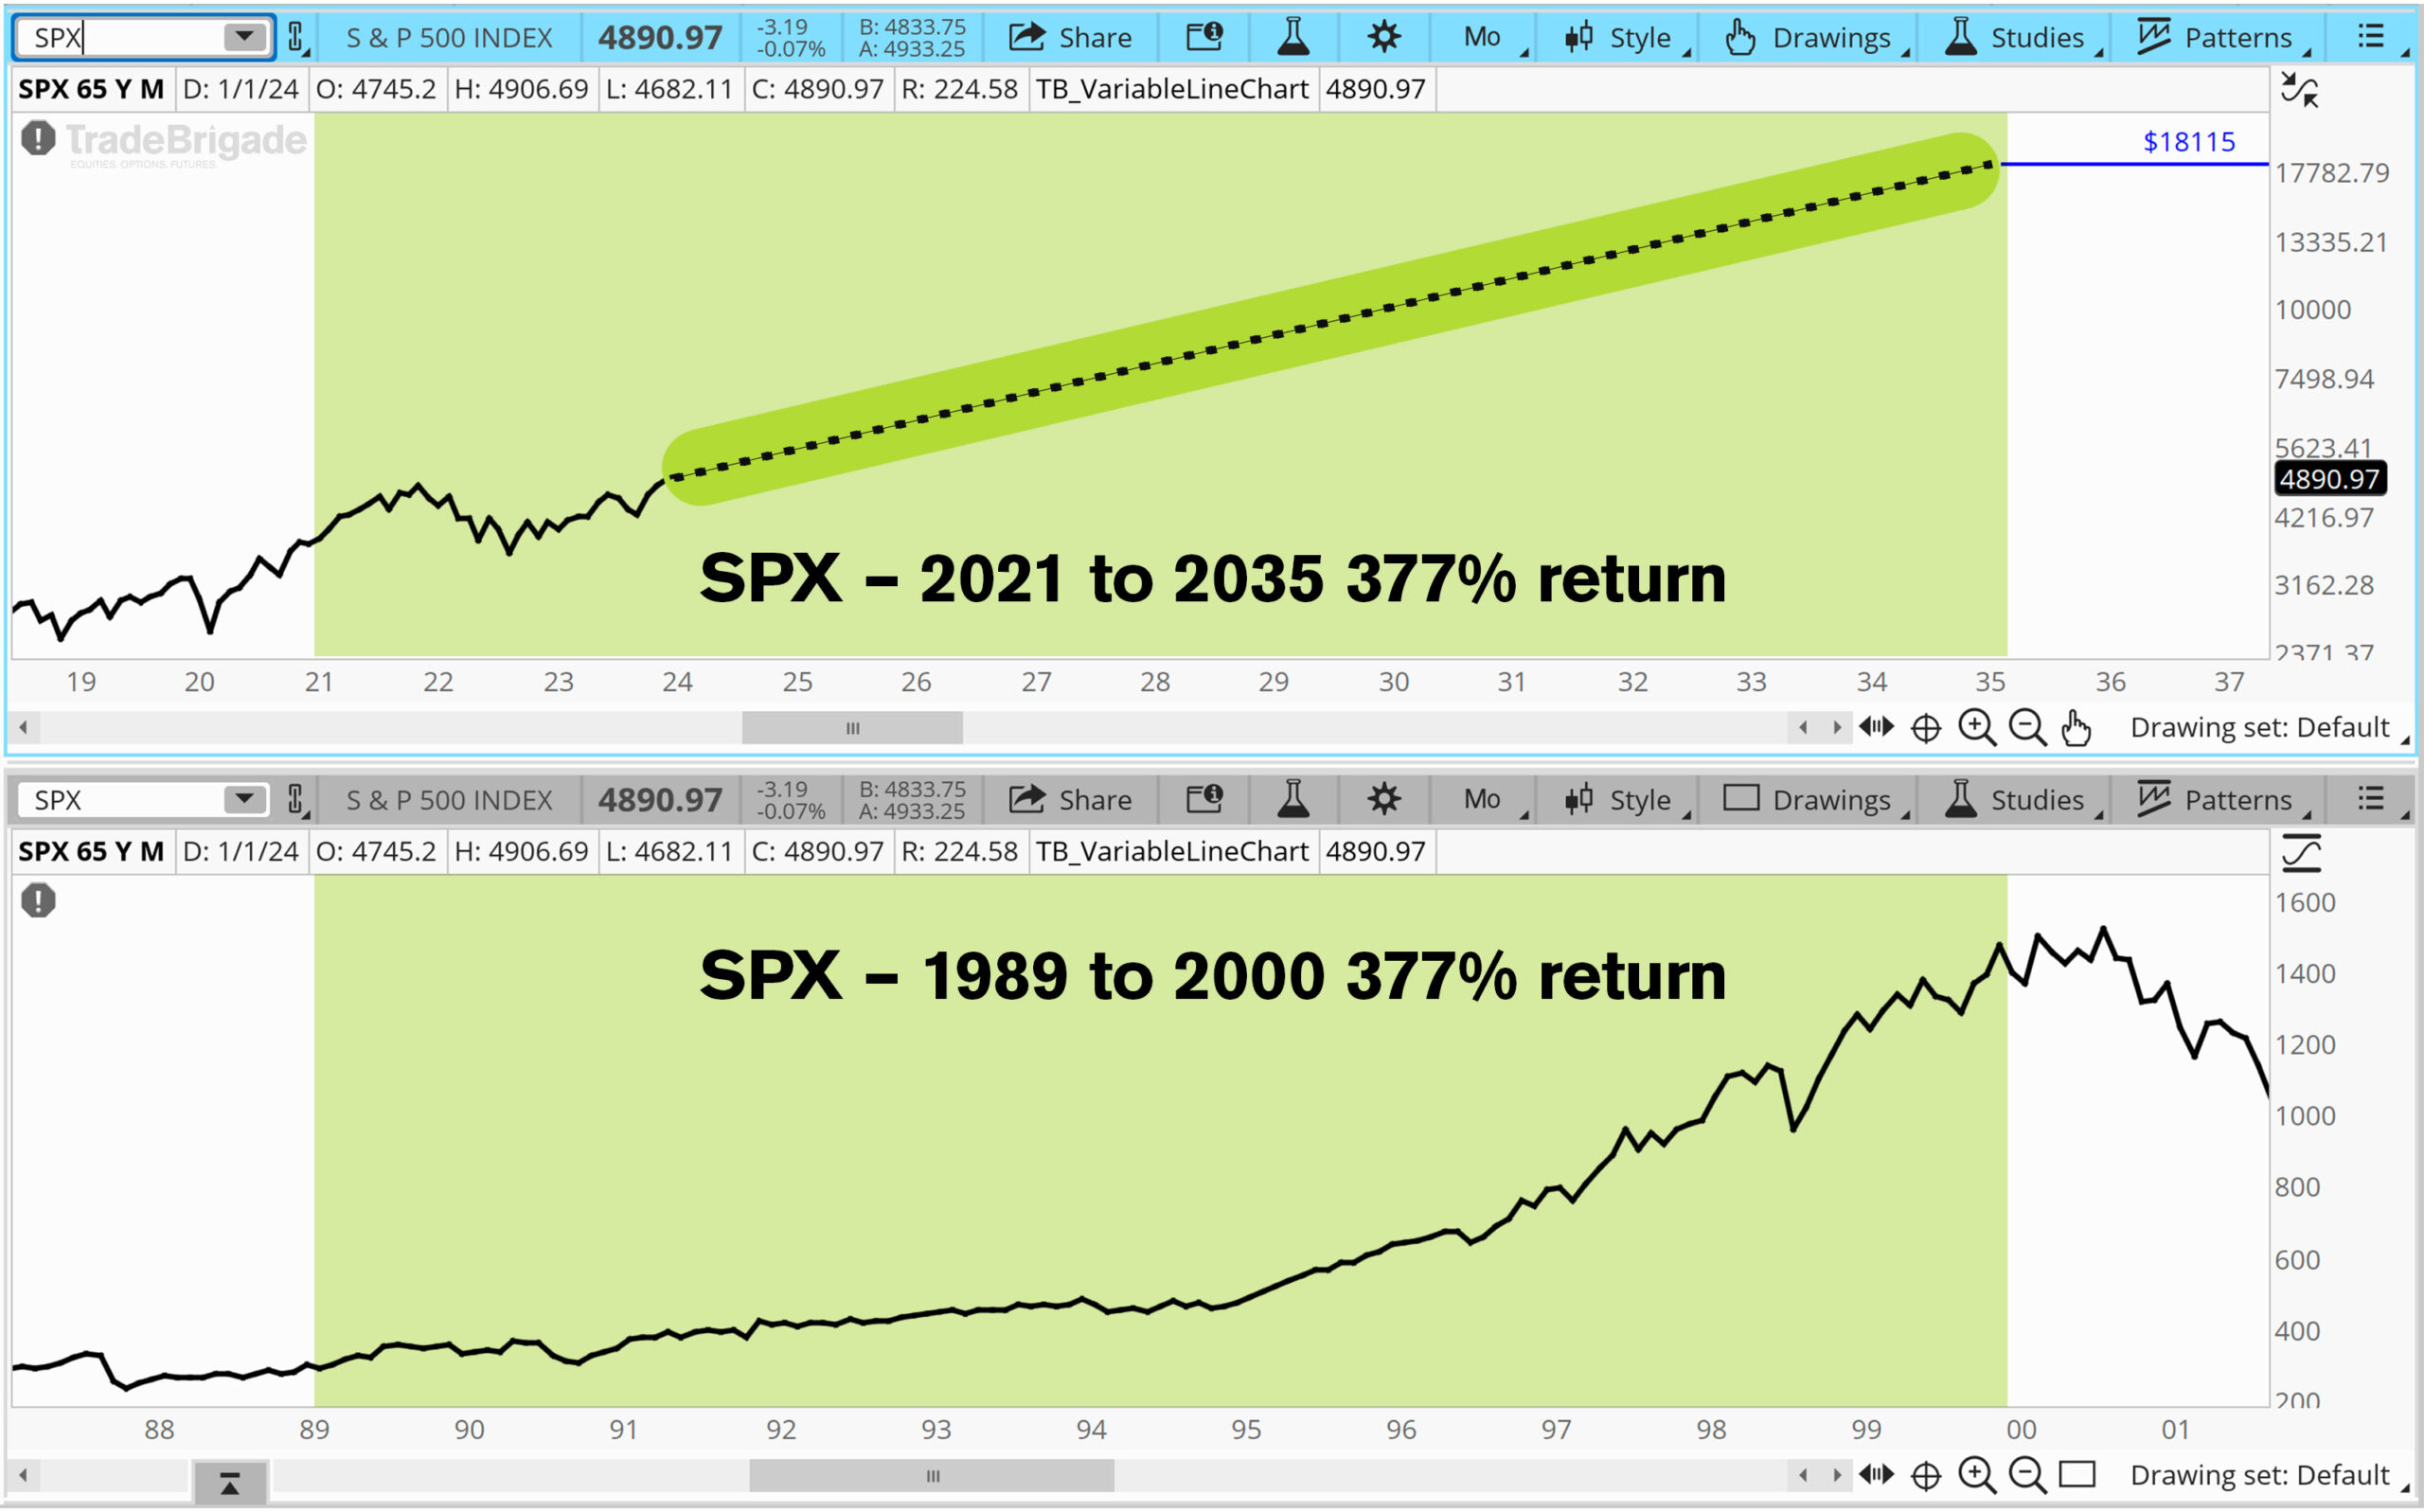
Between 2021-2035 the youngest Millennials were 25 and oldest Millennials will be 54. (top)
The issue with this assumption is that it takes the 11 year period for the Boomers and applies the same return over the 14 year period the Millennials have to be in their prime working age group. They are after all a larger and more educated generation, and thus it wouldn’t be unreasonable to assume higher economic output and more productivity.
For more demographic analysis, see Ciovacco Capitals article here: Demographics: A Triple Economic Boom is Coming
Considering the evidence above, it appears as though the Fed should have an easier time engineering the soft landing compared to a recession. Demographics suggest labor market tailwinds applied to an already resilient labor market and inflation well on its way towards price stability. Lets add into the mix the impact of artificial intelligence being used by the most educated generation on productivity and market valuation.
The Promise of Generative AI
Artificial intelligence (AI) has existed for over 50 years but in 2023, the world experienced a paradigm shift where AI was suddenly a household term. The release of ChatGPT from Open AI sparked a public race to artificial general intelligence (AGI). With this race comes massive investment. Microsoft purchased a 49% stake in Open AI and additionally venture capitalists independently invested roughly $36 billion into AI, more than double the investment from 2022.
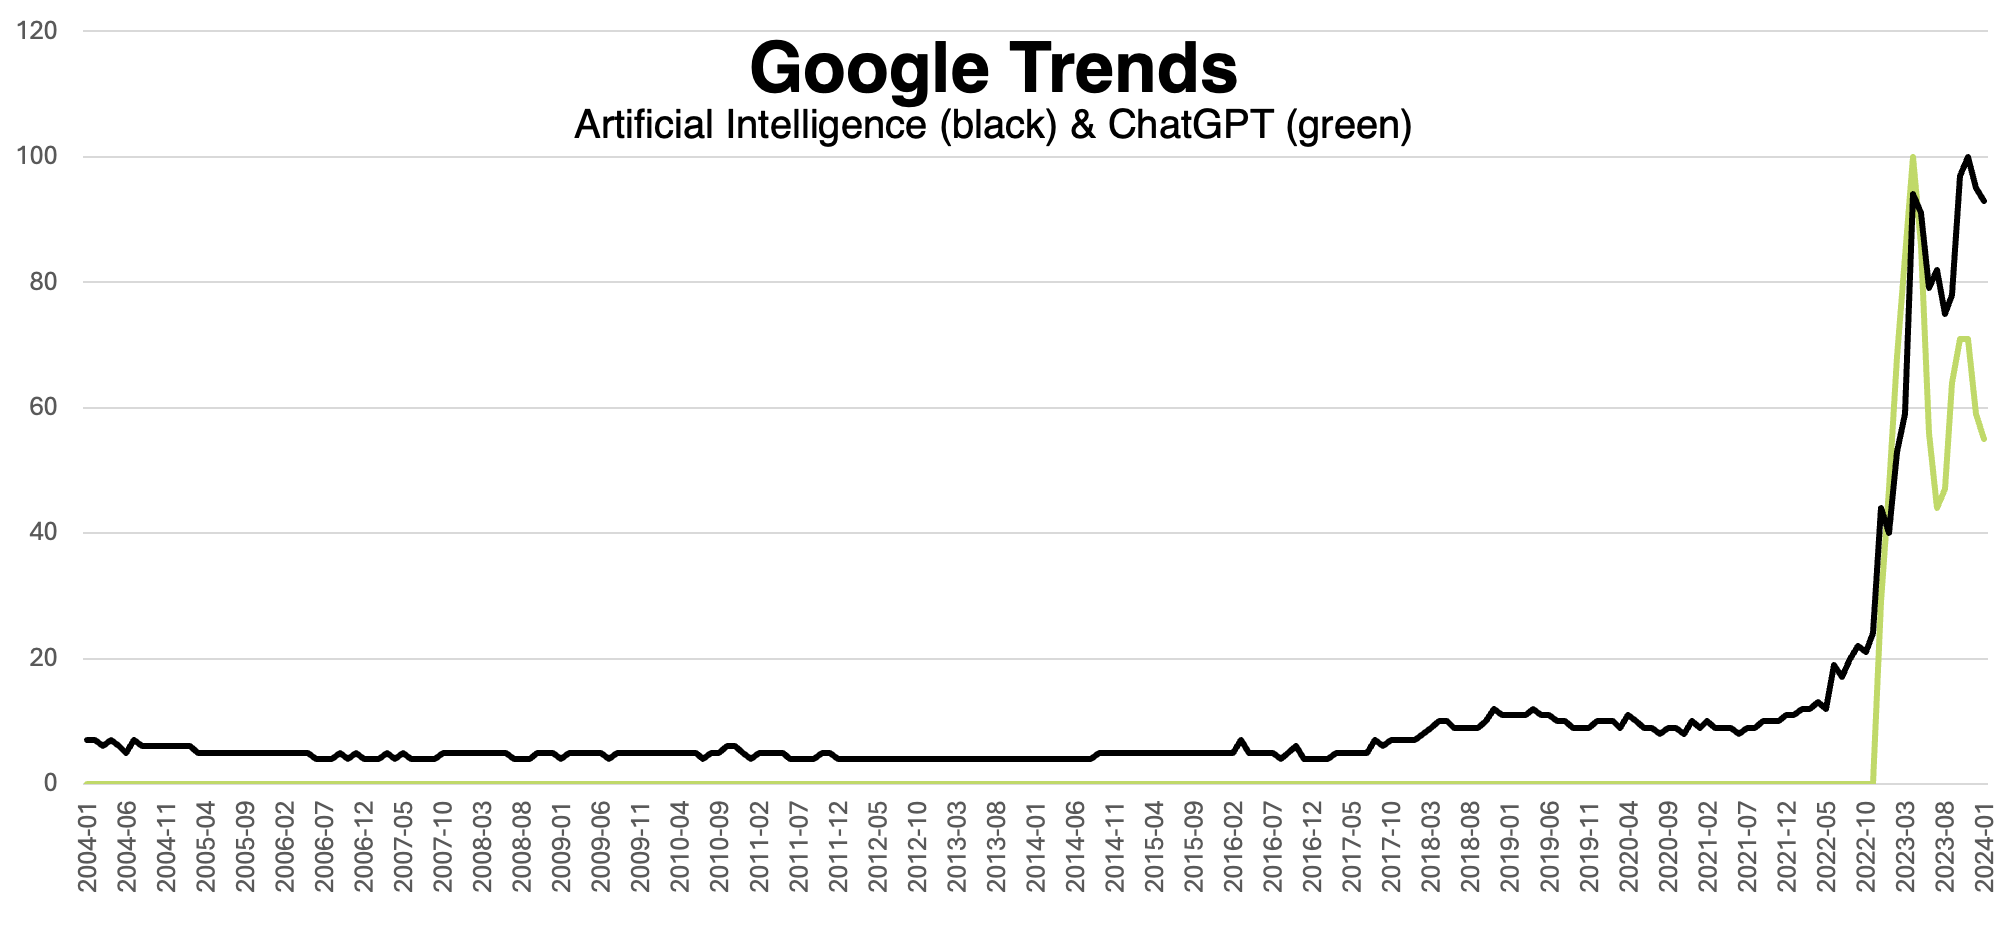
Sam Altman, CEO of OpenAI, reported that ChatGPT had more than 100 million weekly users and that more than 90% of Fortune 500 companies use the program. AI dominated the narrative, with some analysts suggesting AI saved the US economy from a recession.
As AI progresses, the largest beneficiaries will be companies outside of the technology sector. As an example, think of a service based business integrating an AI tool to improve their efficiency. Companies with strong data management systems already in place will be first to integrate. The magnitude of that edge for the service businesses will be larger on a relative basis compared to the edge a tech company gains by building AI in the immediate term. A study from IDC finds that companies integrating AI solutions are realizing on average a 350% return on every dollar spent. (IDC The Business Opportunity of AI)
The builders of AI on the other hand are still investing money into development without seeing massive return in their P&L statement. Microsoft only saw 3% of Azure’s growth coming from generative AI products, including the access Microsoft provides to OpenAI’s GPT-4 language model. (Microsoft Q3 2023 Earnings)
The largest risk for AI builders is ultimately the commoditization of the product. Microsoft, Google, Amazon, and Meta will all have a race to the bottom once compute is standardized. A parallel analogy would be the commoditization of IT around the 2000s. (Frontiers) Understanding the longer run implication means that the economy must expand based on productivity gains, not just the development of the tool. In essence, the promise of AI is the promise of productivity, and if that promise is not fulfilled, what is this other than a speculative bubble.

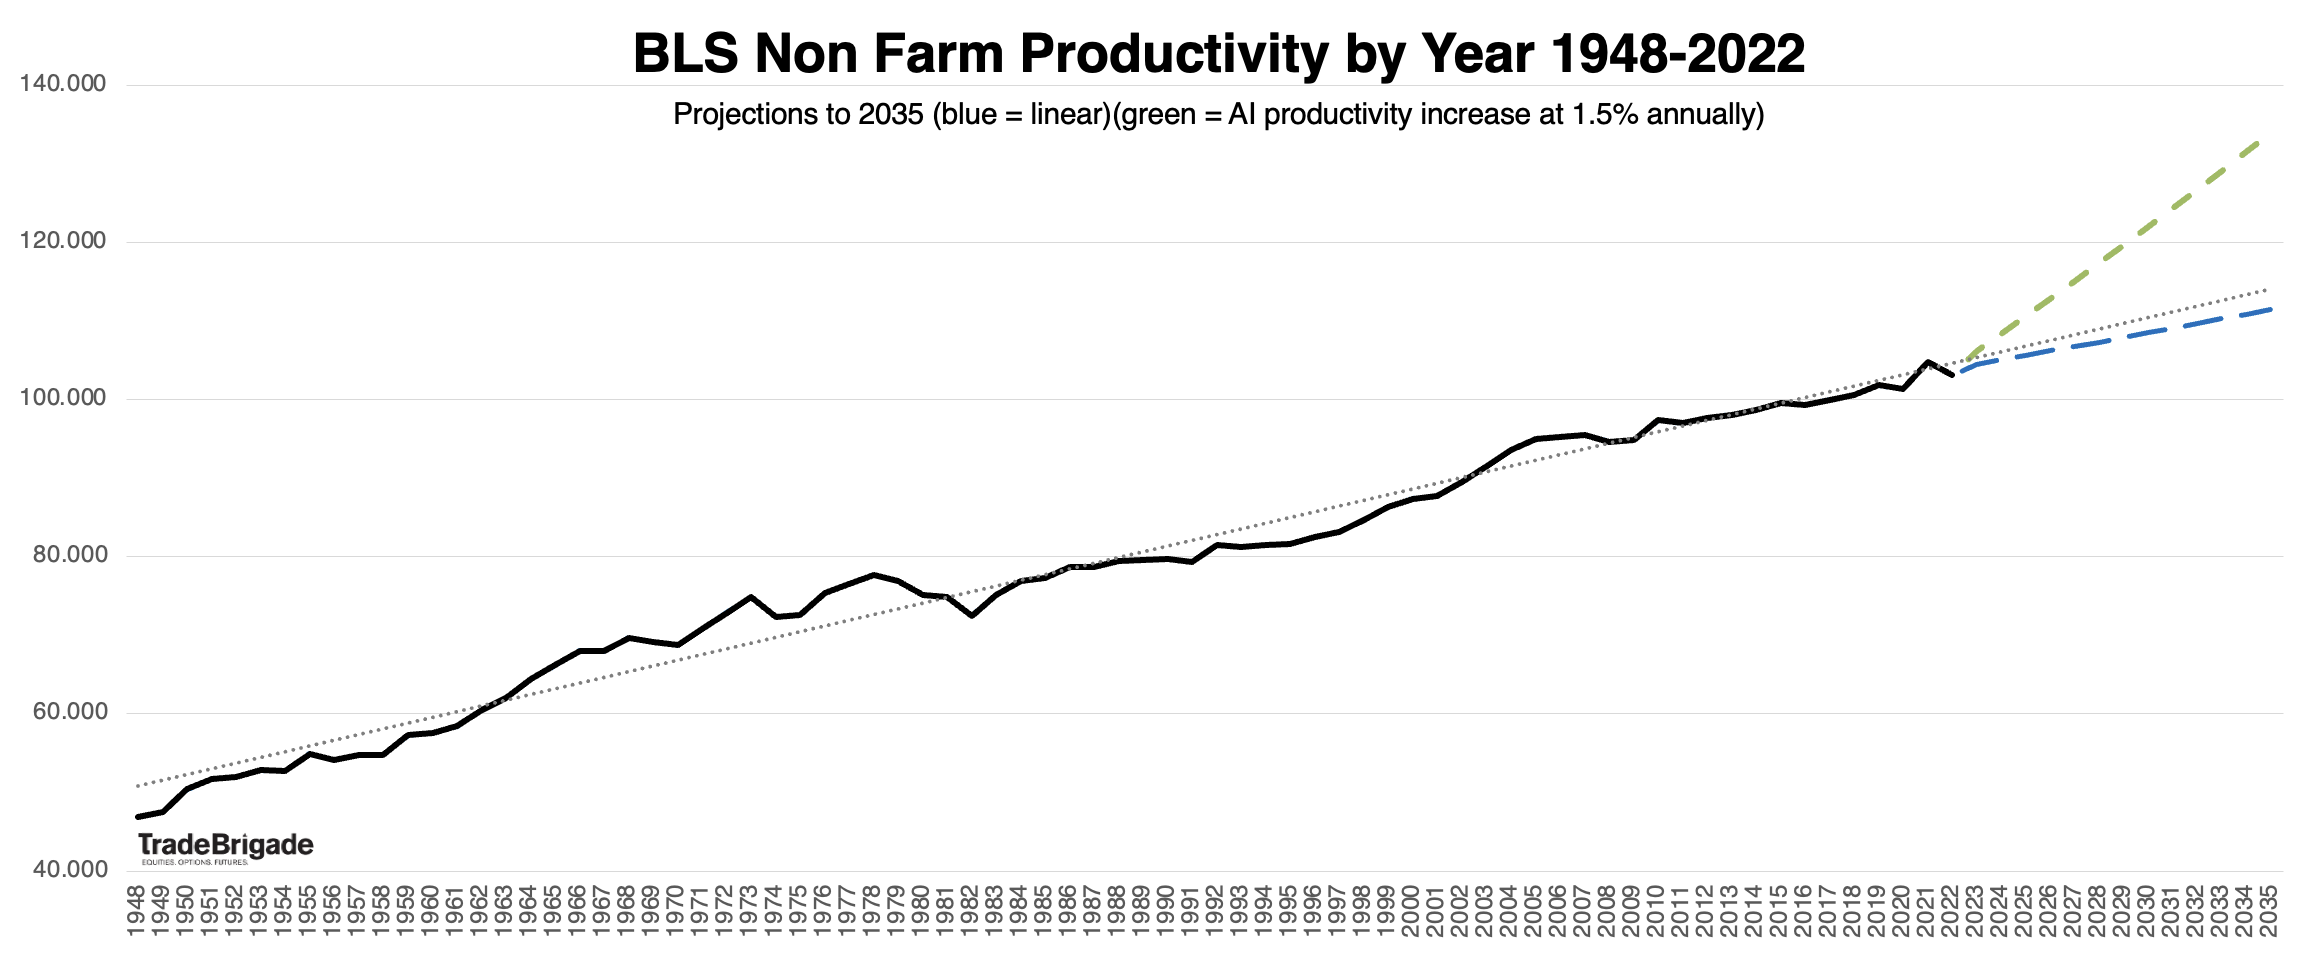
So… Let’s Get Productive
The headlines on AI productivity are all promising. Wall Street economists in aggregate predict that AI has the potential to increase productivity by 1.5% annually over the next decade. Goldman Sachs predicts US GDP increasing by 7% by 2033. PricewaterhouseCoopers (PwC), predicts a global GDP increase of 14% by 2030, an estimated equivalent of $15.7 trillion. PwC attributes this growth to two factors; $6.6 trillion from increased productivity, and $9.1 trillion from consumption side effects.
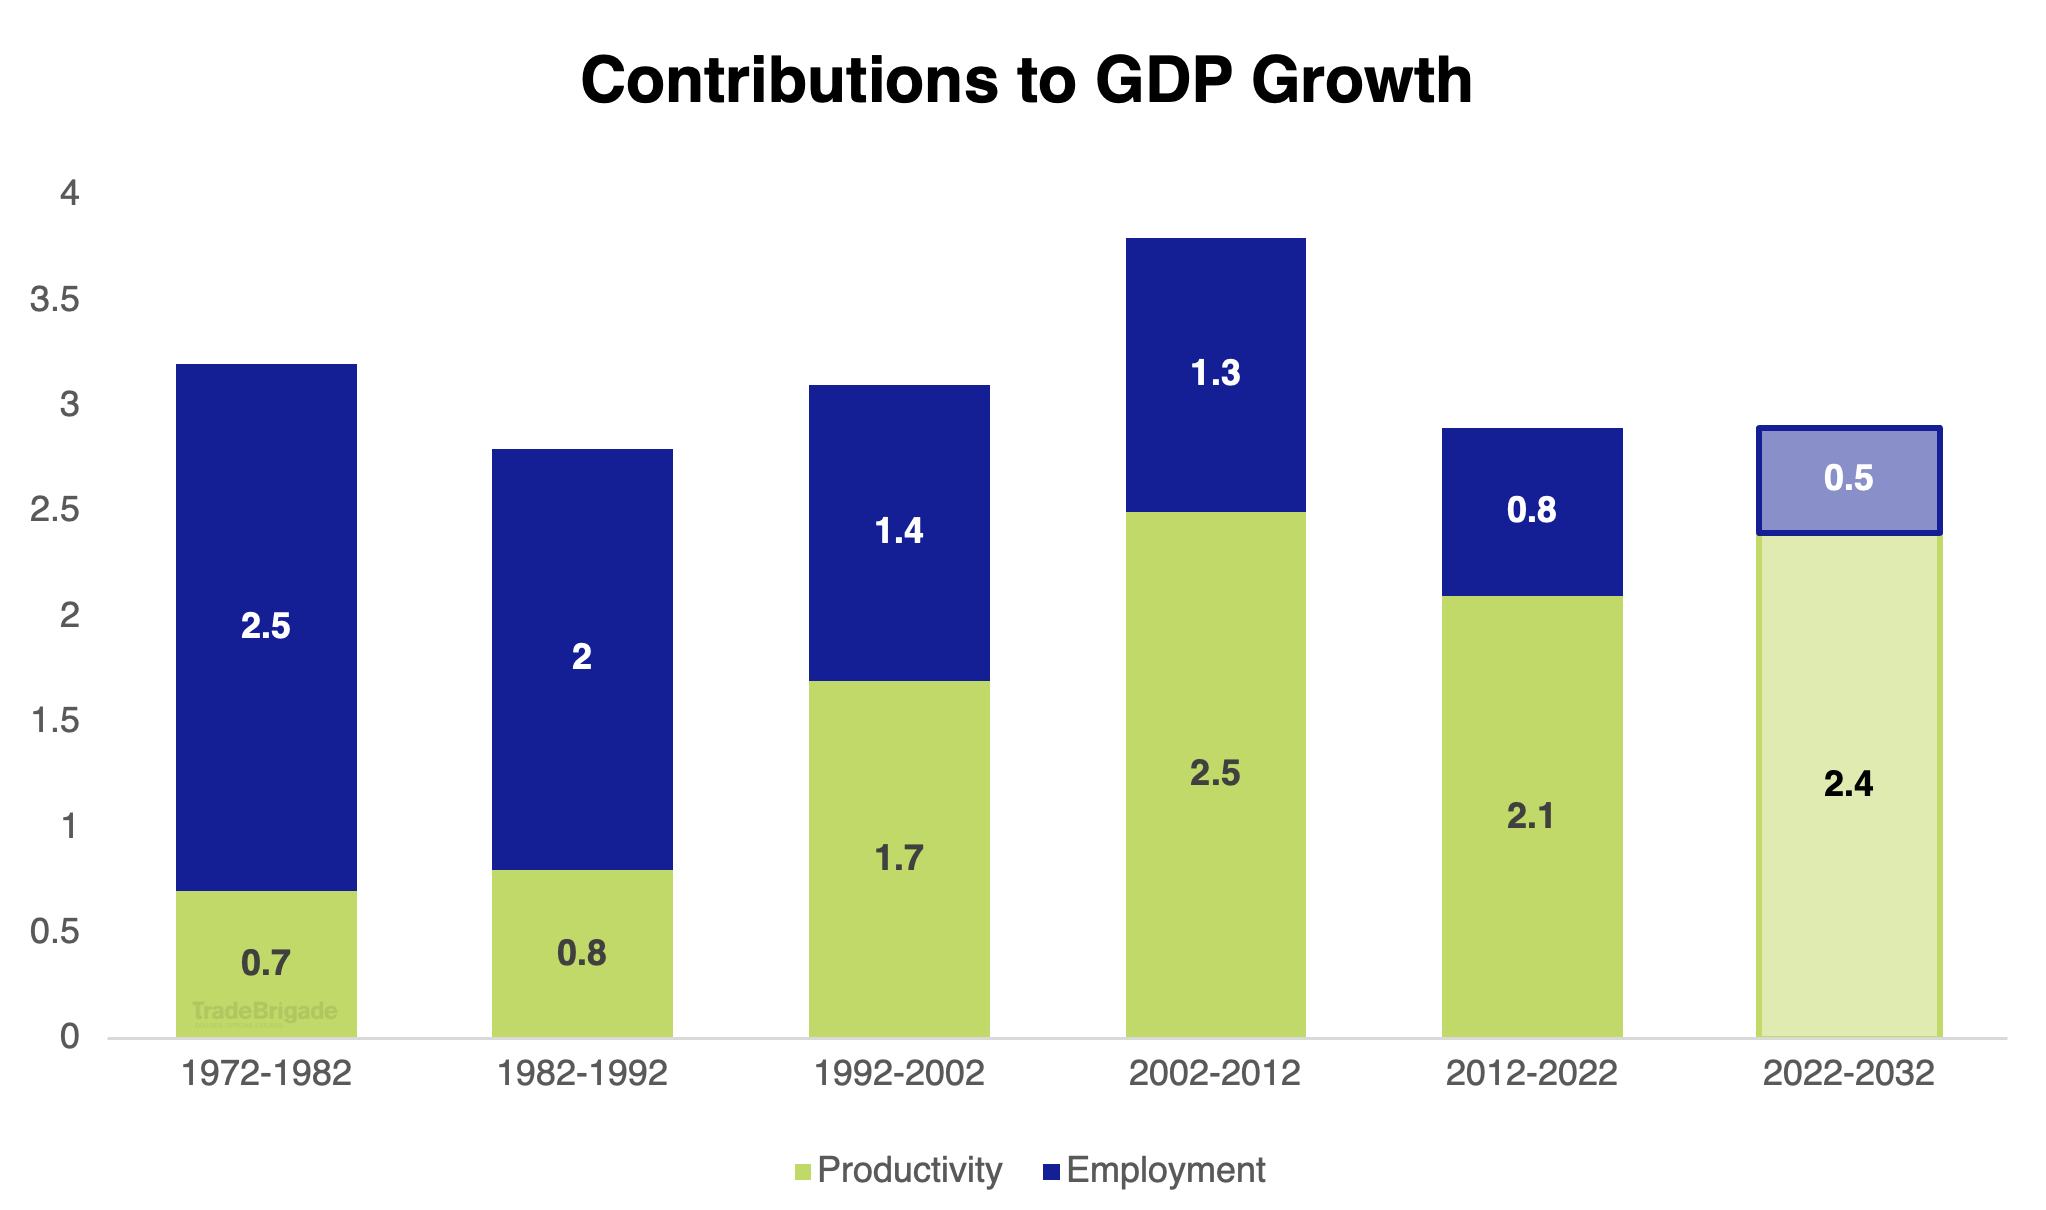
Let’s hypothetically apply a 15% multiplier to the productivity contribution over a decade to GDP to roughly mirror the above forecast of 1.5% increase annually. We’ll assume the employment contribution to GDP contracts by roughly 38% as it did between the two periods ending 2012 and 2022. You can still see an unchanged GDP result for the following decade. But, let’s not forget about our demographic analysis. Is it likely we get another contraction of the labor force? The data would suggest no. So stability actually gives us a 30 basis point increase, and any additional gain in employment will bolster GDP even further. (McKinsey)
If the Promise is Broken
US GDP is not completely correlated to market returns (CFA Institute) however it is an important marker of economic stability and health. If the promise of AI is broken or mass adoption takes longer than expected, it is totally reasonable to expect a stable or contracting GDP. What we are left with is a Magnificent 7 cohort of companies left to the same fate as the CSCO dot com boom. Potential headwinds to AI that could take us down this path revolve around data privacy/security, ethics, and regulation. A theme to watch in the Era of AI is going to be cybersecurity companies.
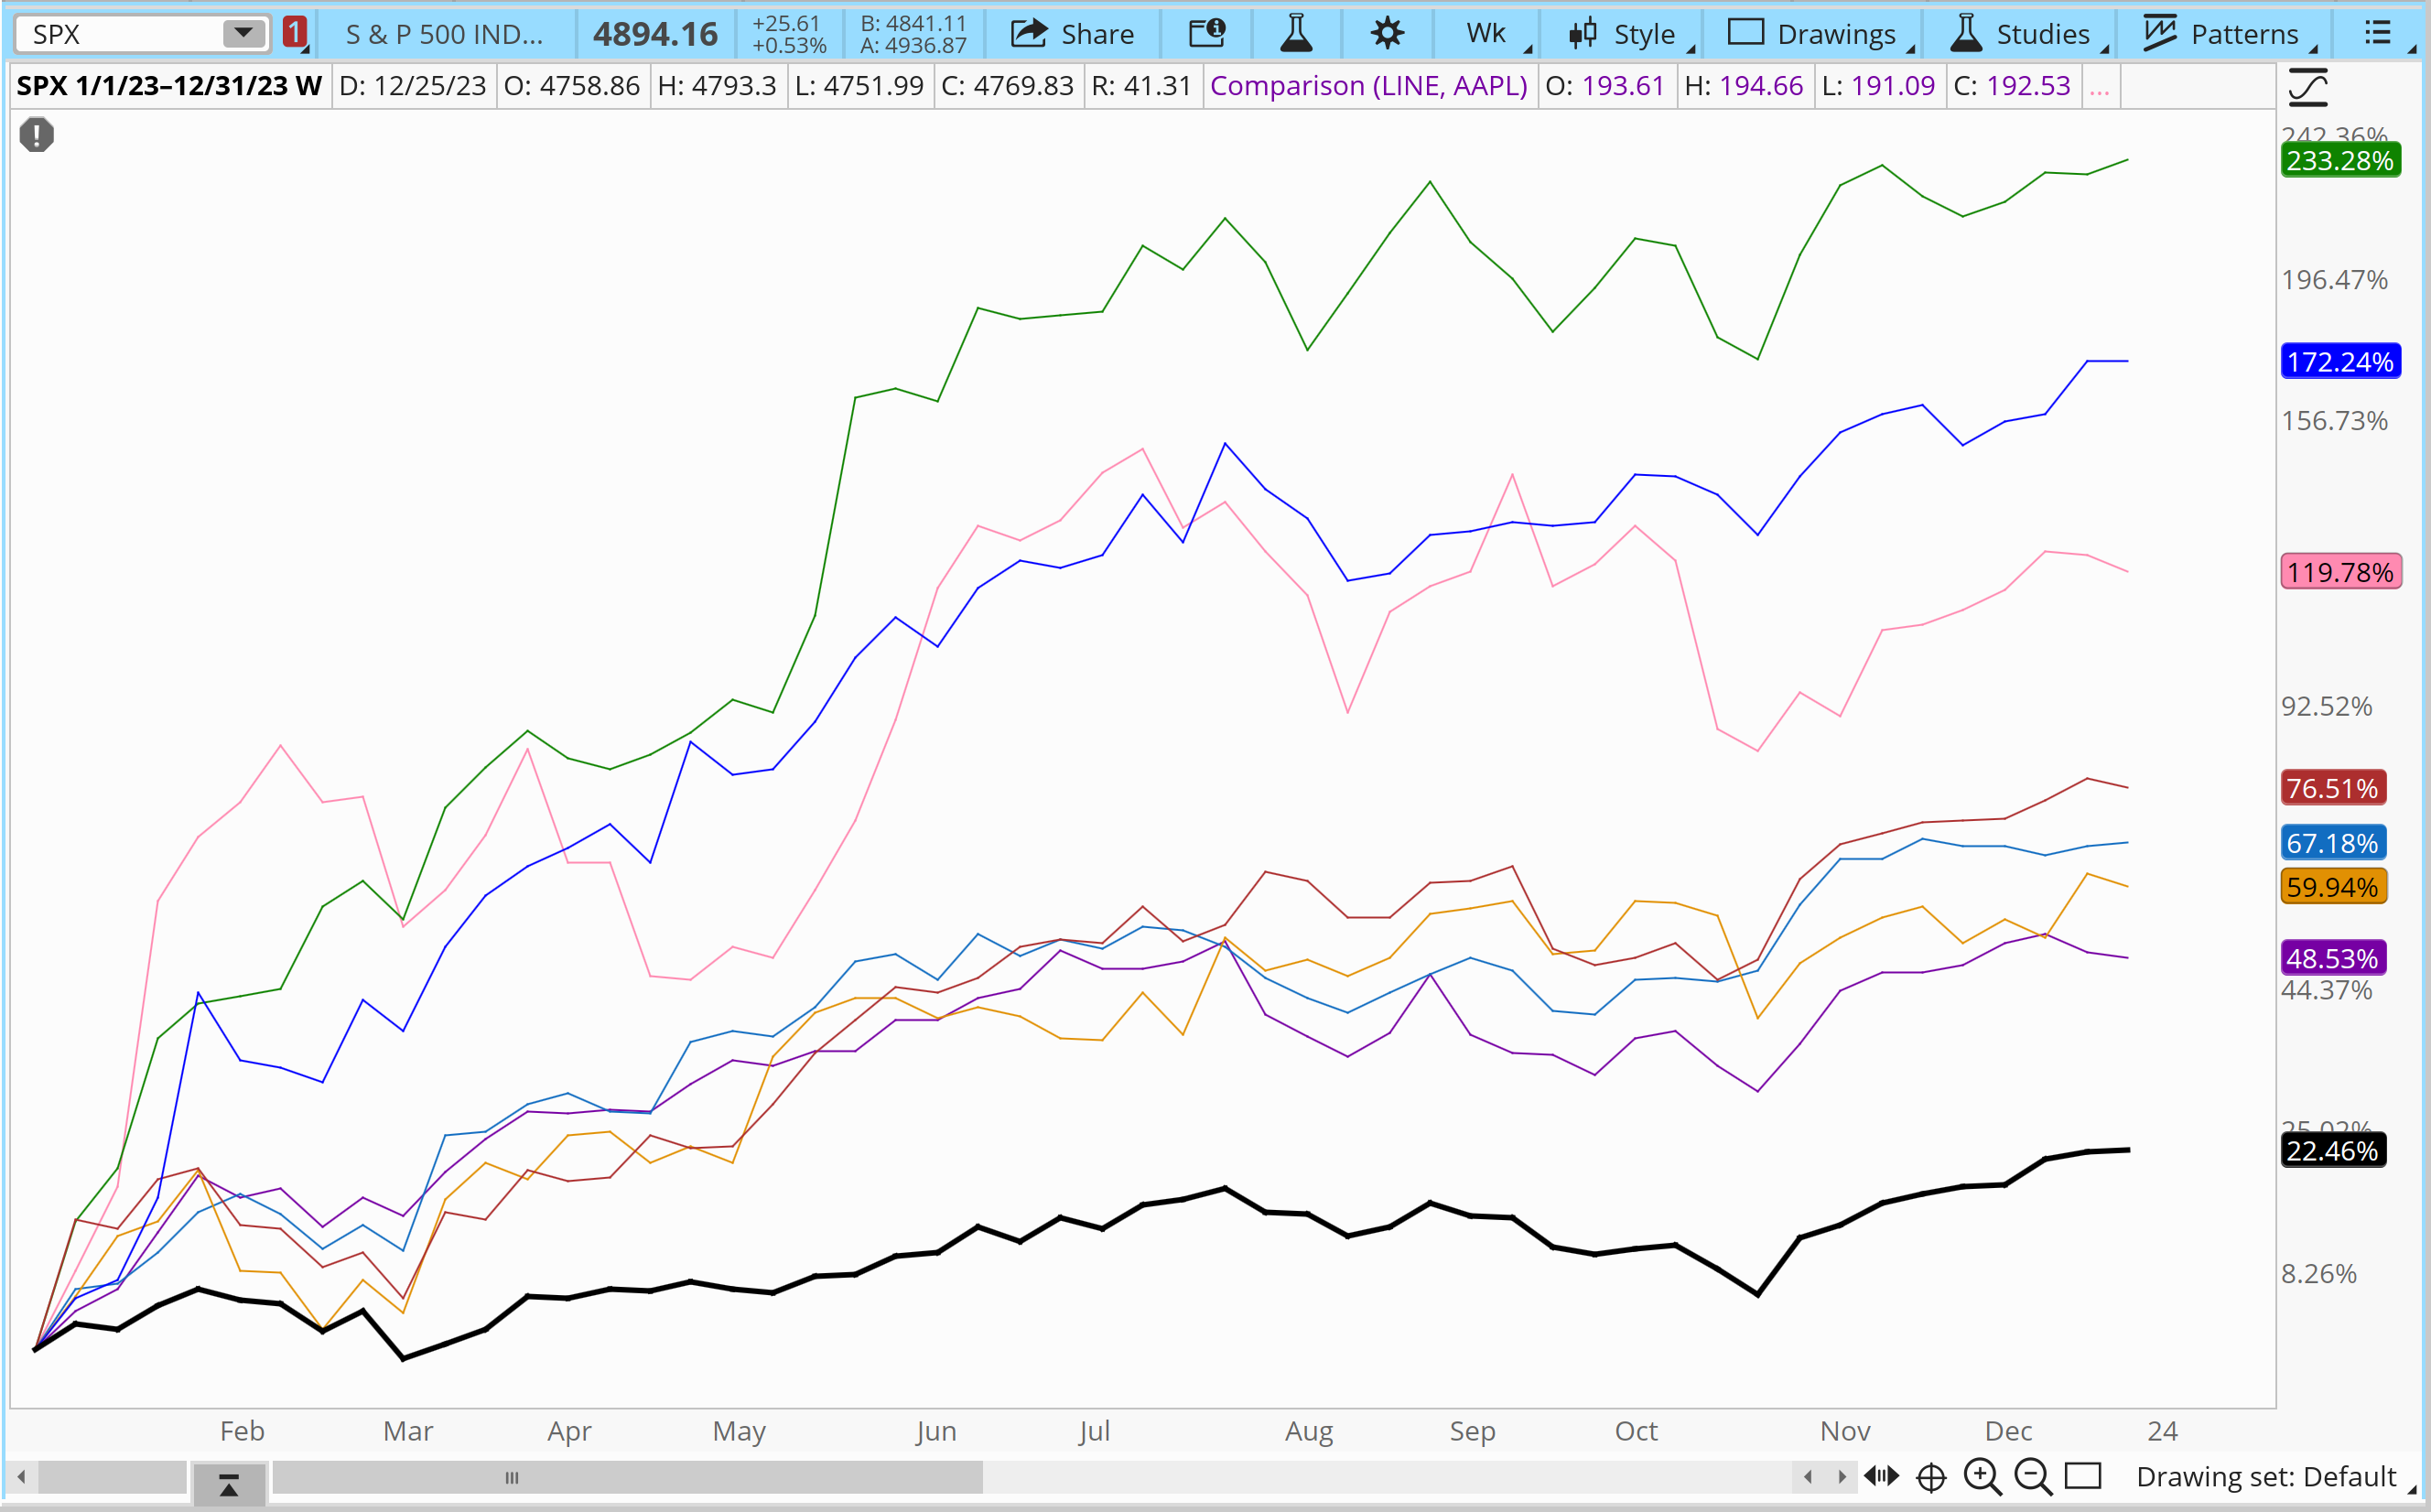
Magnificent 7
A large portion of stock market gains in 2023 were fueled by the Magnificent 7. Of the total 23+% return of the S&P 500 in 2023, the Mag 7 returned 71% while the other combined 493 stocks returned only 6%. Not a bad showing, however extremely concentrated returns for the S&P. Some analysts see this as a risk for the market moving forward where we see it as an implicit result of the design of the index. Remember that the S&P is a capitalization weighted index. Imagine the opportunity cost if the index was not cap weighted and the Mag 7 passed you by in 2023. Sure your 11% equal weight return was good, but you left more than half of the return on the table with no risk adjusted compensation to the weighted S&P.
In 2024 we see two possible outcomes for the Magnificent 7. First let’s assume the worst and say that the labor market contracts and the Fed loses control of price stability. Because the Mag 7 companies have balance sheets that are flush with cash, we don’t see a massive correction to valuations. That correction has happened already in 2022 in anticipation of a higher rate environment. So mild pullback to stable appears to be the worst case.
Secondly, the Fed pulls off a soft landing, rates come down respectfully and not in an attempt to bring us out of weak economic conditions. In this scenario, the Mag 7 will continue to outperform but to a lesser magnitude of 2023. This forecast is on the premise of continued AI development, and seeing the return on investment finally hit the P&L statements towards the second half of FY24. We will dial back expectations from 2023’s performance due to valuations running rich, preventing new money investors from wanting to deploy capital aggressively at these levels.
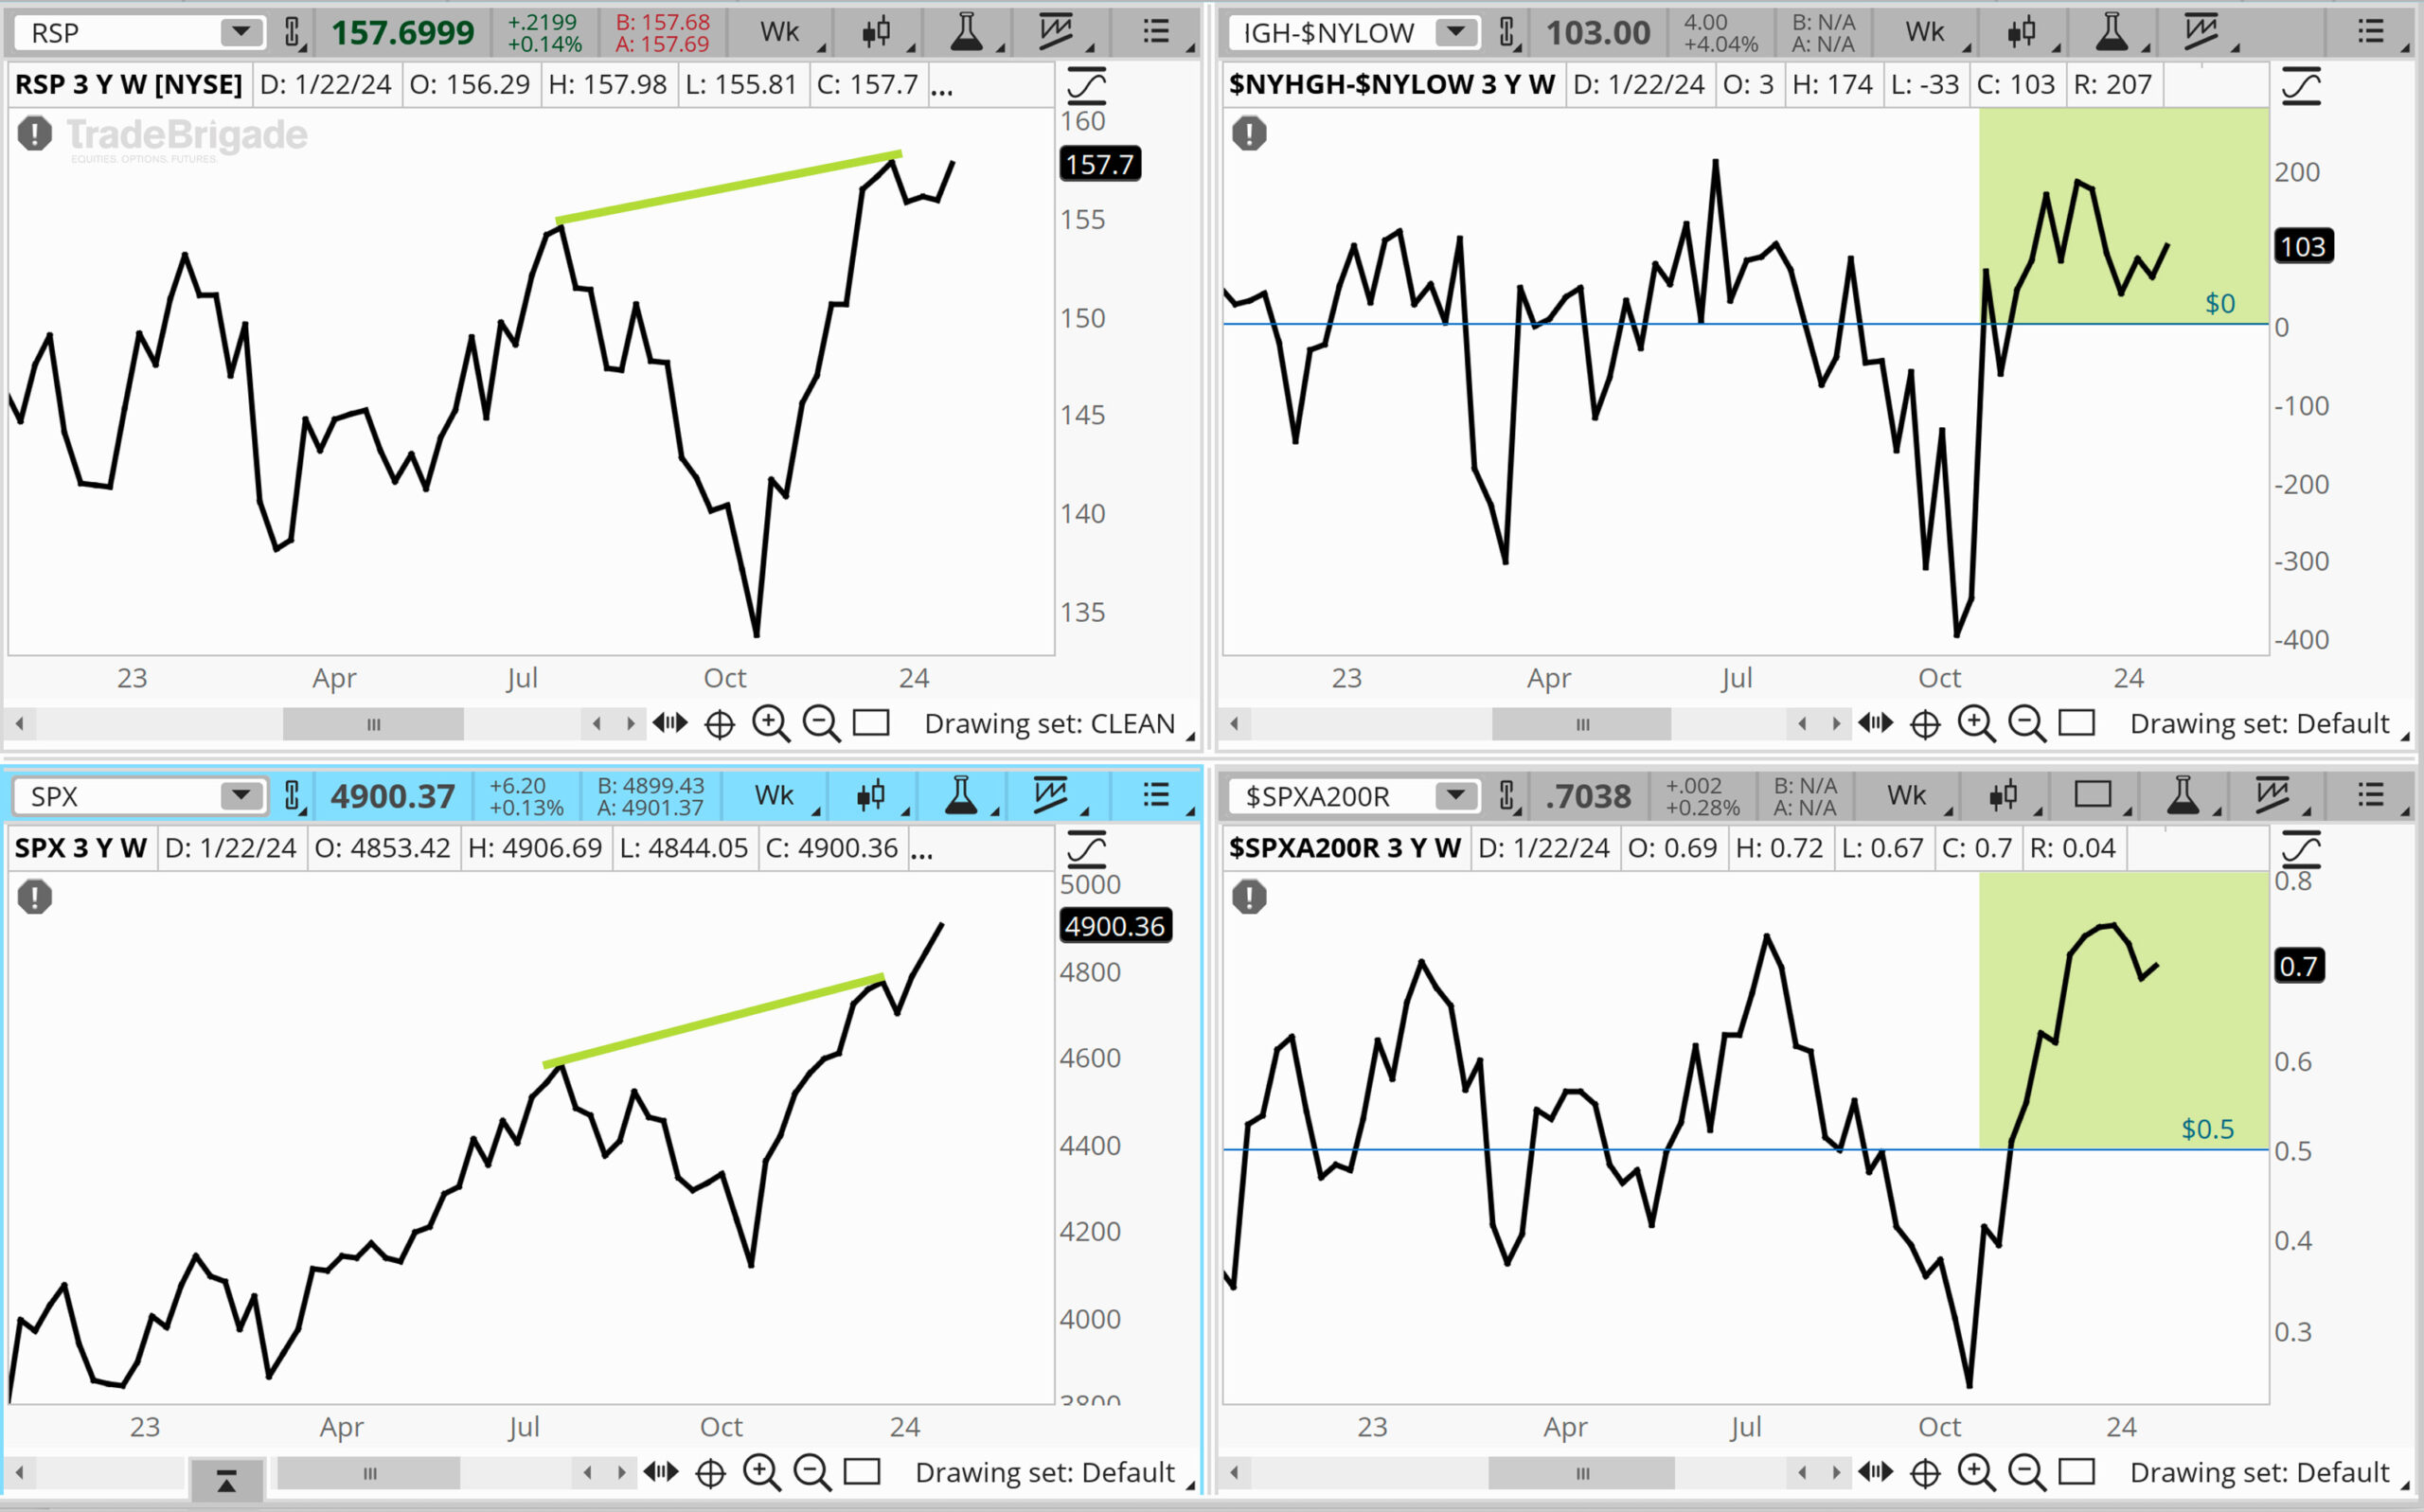
Concentration Risk Blunted By Breadth Improvements
Although the Mag 7 has driven a highly concentrated amount of S&P return for 2023, Q4 signaled promising signs of breadth improvement. We see the number of new highs vs new lows at the NYSE exchange level recovering from negative to positive, more than 50 percent of stocks trading above the daily 200 SMA in the S&P 500 and the equal weight index not diverging from the new Q4 swing high.
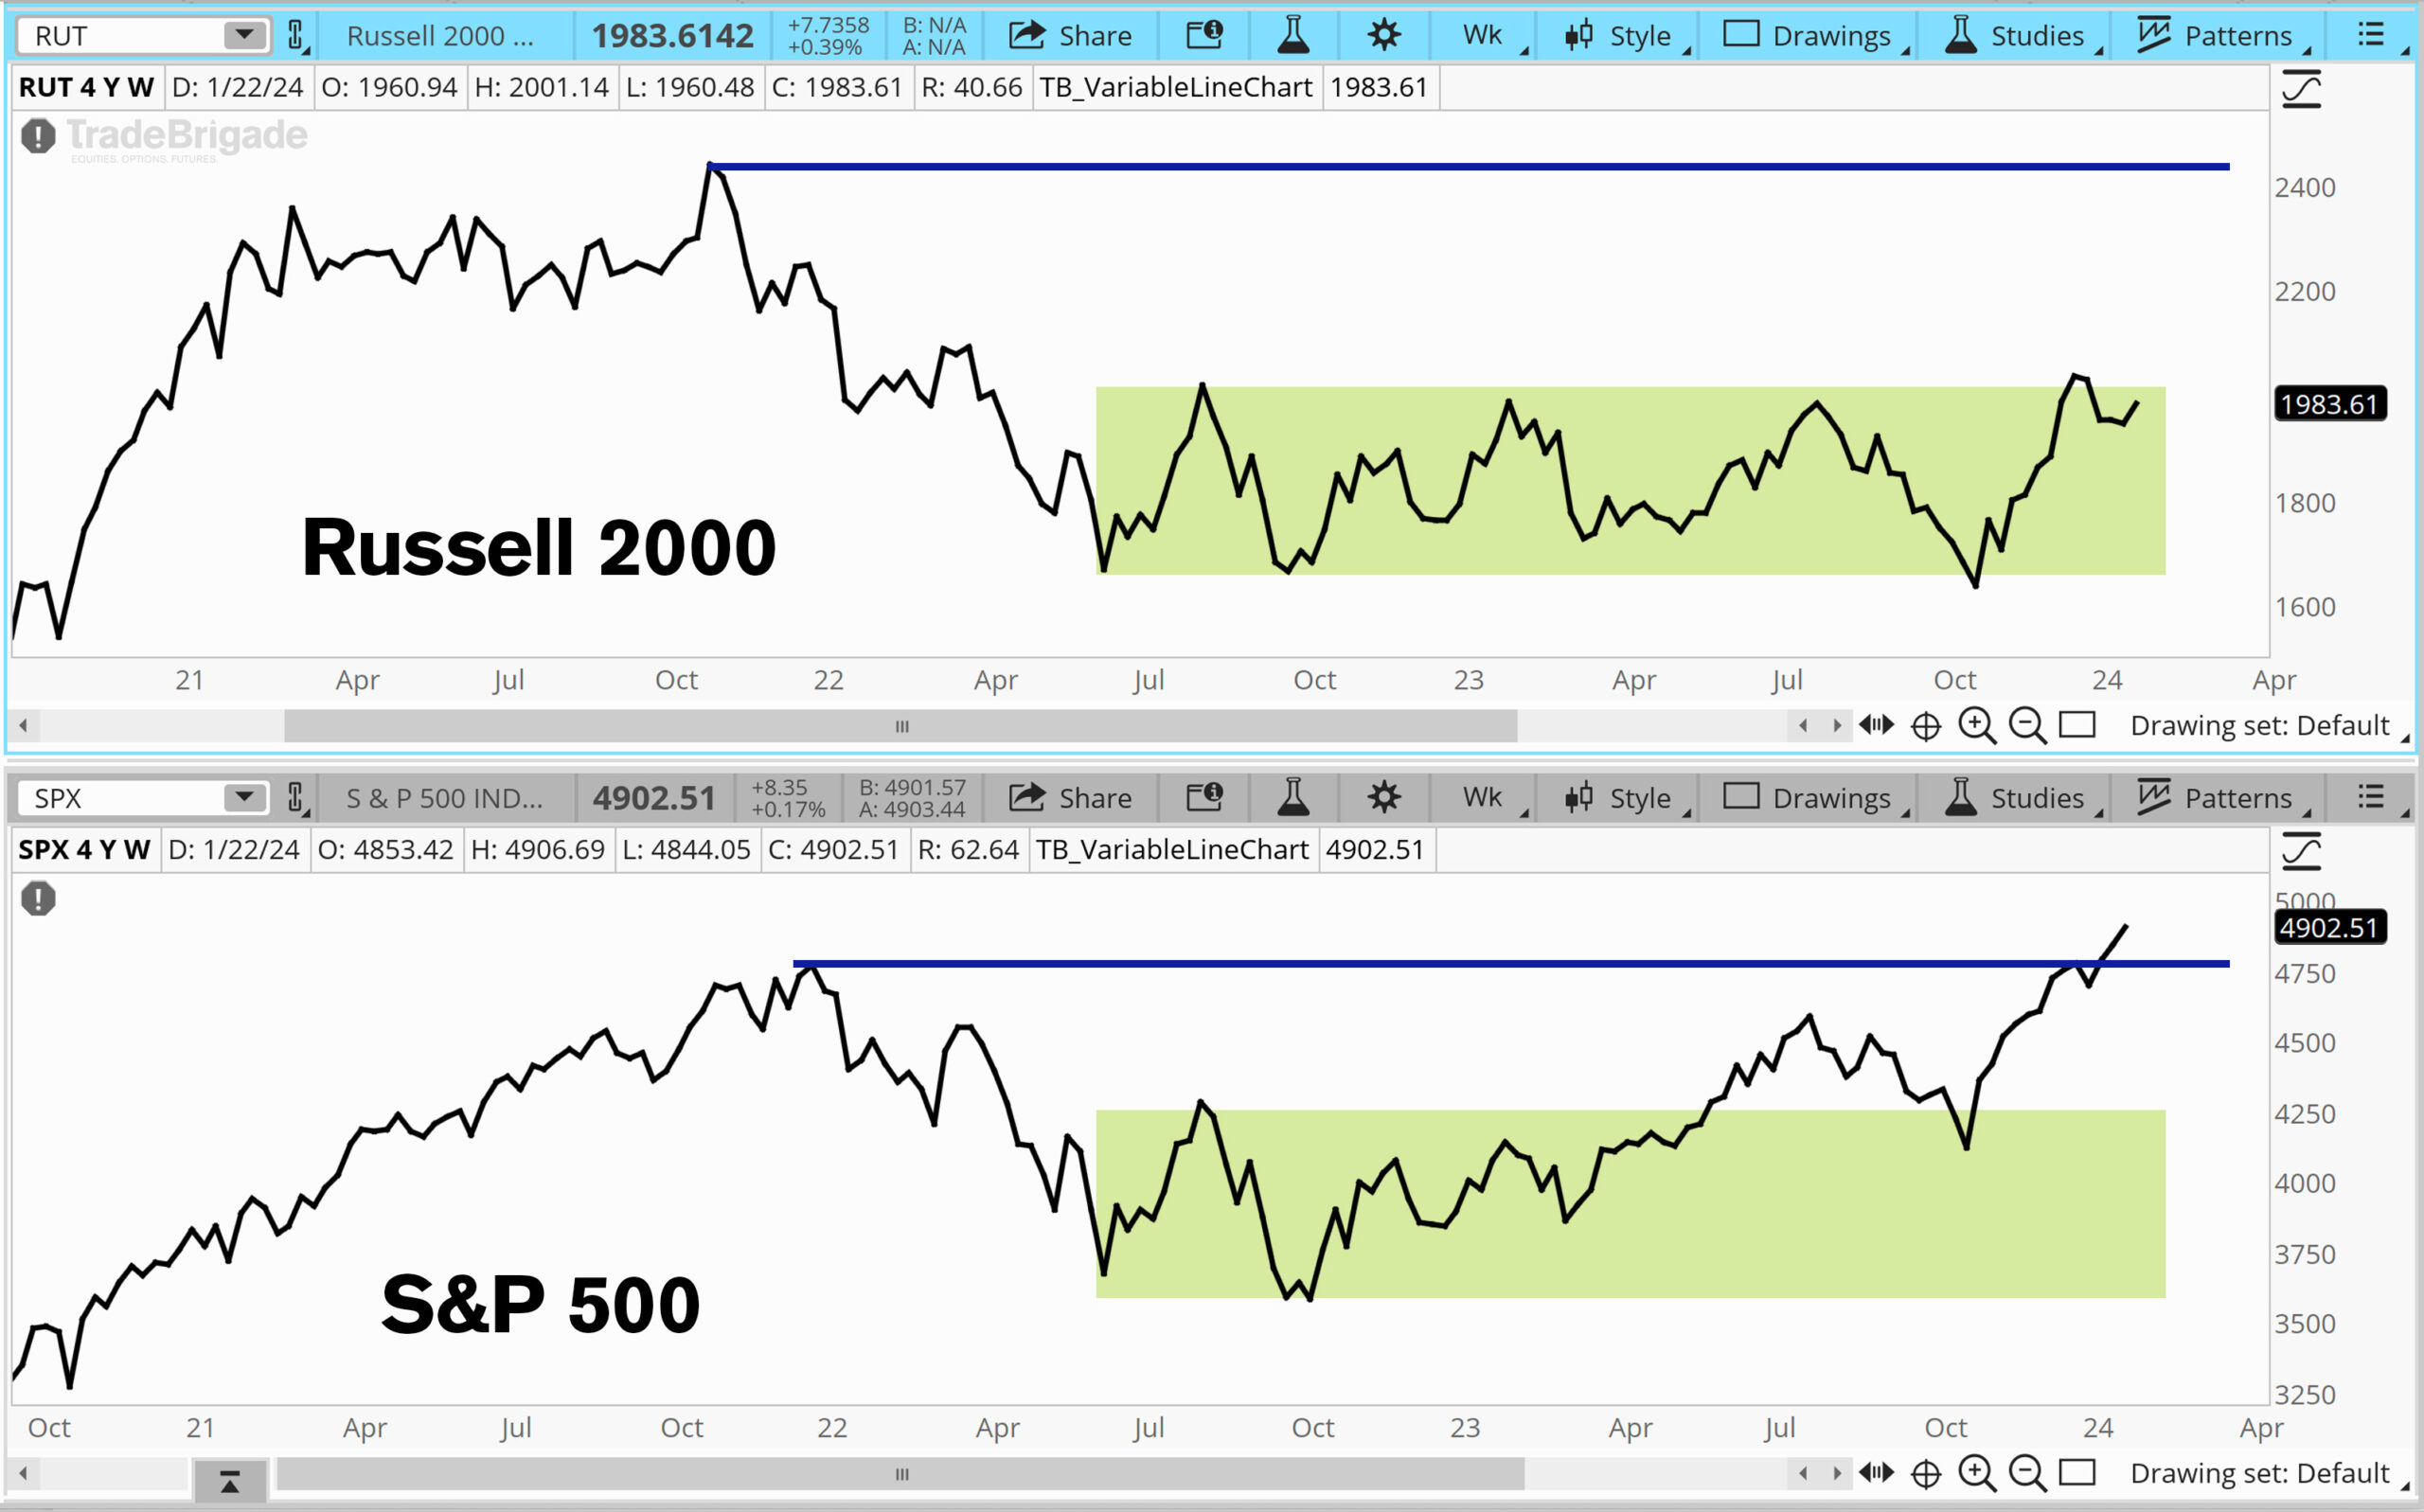
Another indication of market breadth improvement in Q4 comes from the small caps Russell 2000 index. After making a new 52 week low, and breaking the bottom of the balance range during the October rout, it has undergone an impressive recovery effort swinging back to a 52 week high, the fastest low to high rotation in history. As illustrated it has not yet made an all time high whereas the S&P and NASDAQ have.
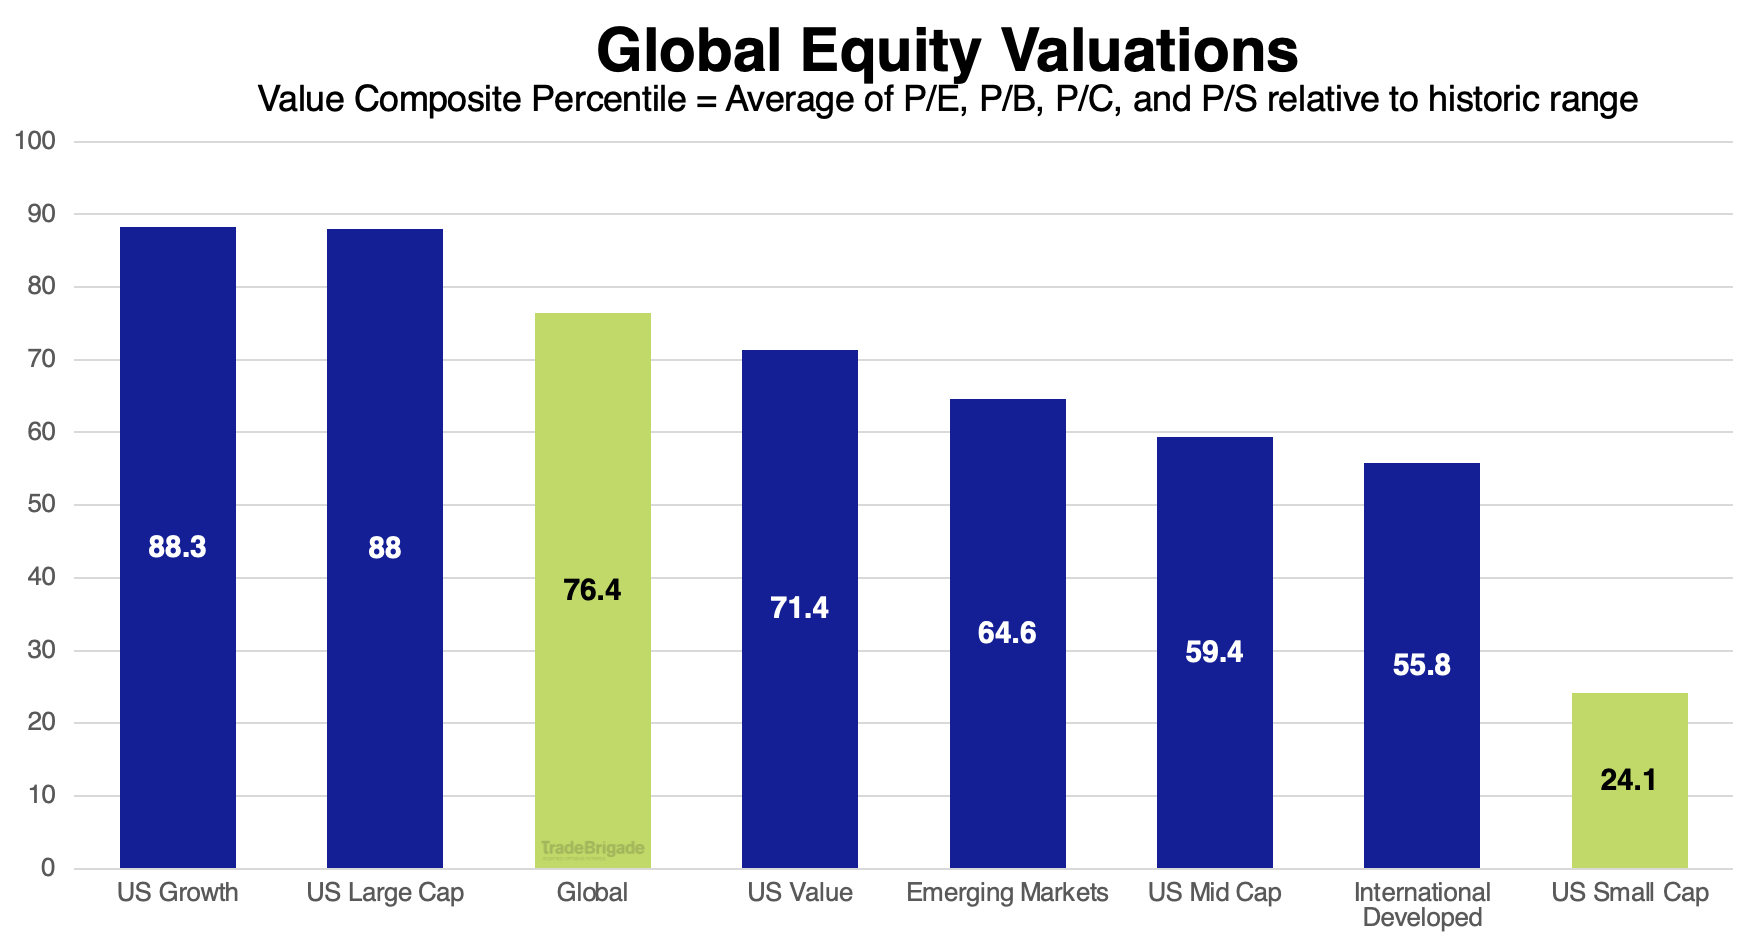
If small caps which have lagged the rally are going to play a game of catch up there are three major contributors to that story. Firstly, as discussed in the Promise of AI segment, the companies that will likely see the largest immediate benefit from AI are small caps. Secondly, the valuations on small caps are far more attractive compared to any other global cohort. Not that lower valuations always mean a good opportunity, but it ticks one of many boxes to help justify deploying capital.
The third reason revolves around an easier operating environment. The Russell 3000, an even broader measure of US equities still inclusive of small caps, has 11.5% composition of zombie companies (Morningstar). These companies under current interest rate conditions can not earn enough to finance their debt. If this is going to change in 2024 to provide a tailwind to small caps, broadening the nature of the rally, we’ve arrived at our second promise. Rate cuts.
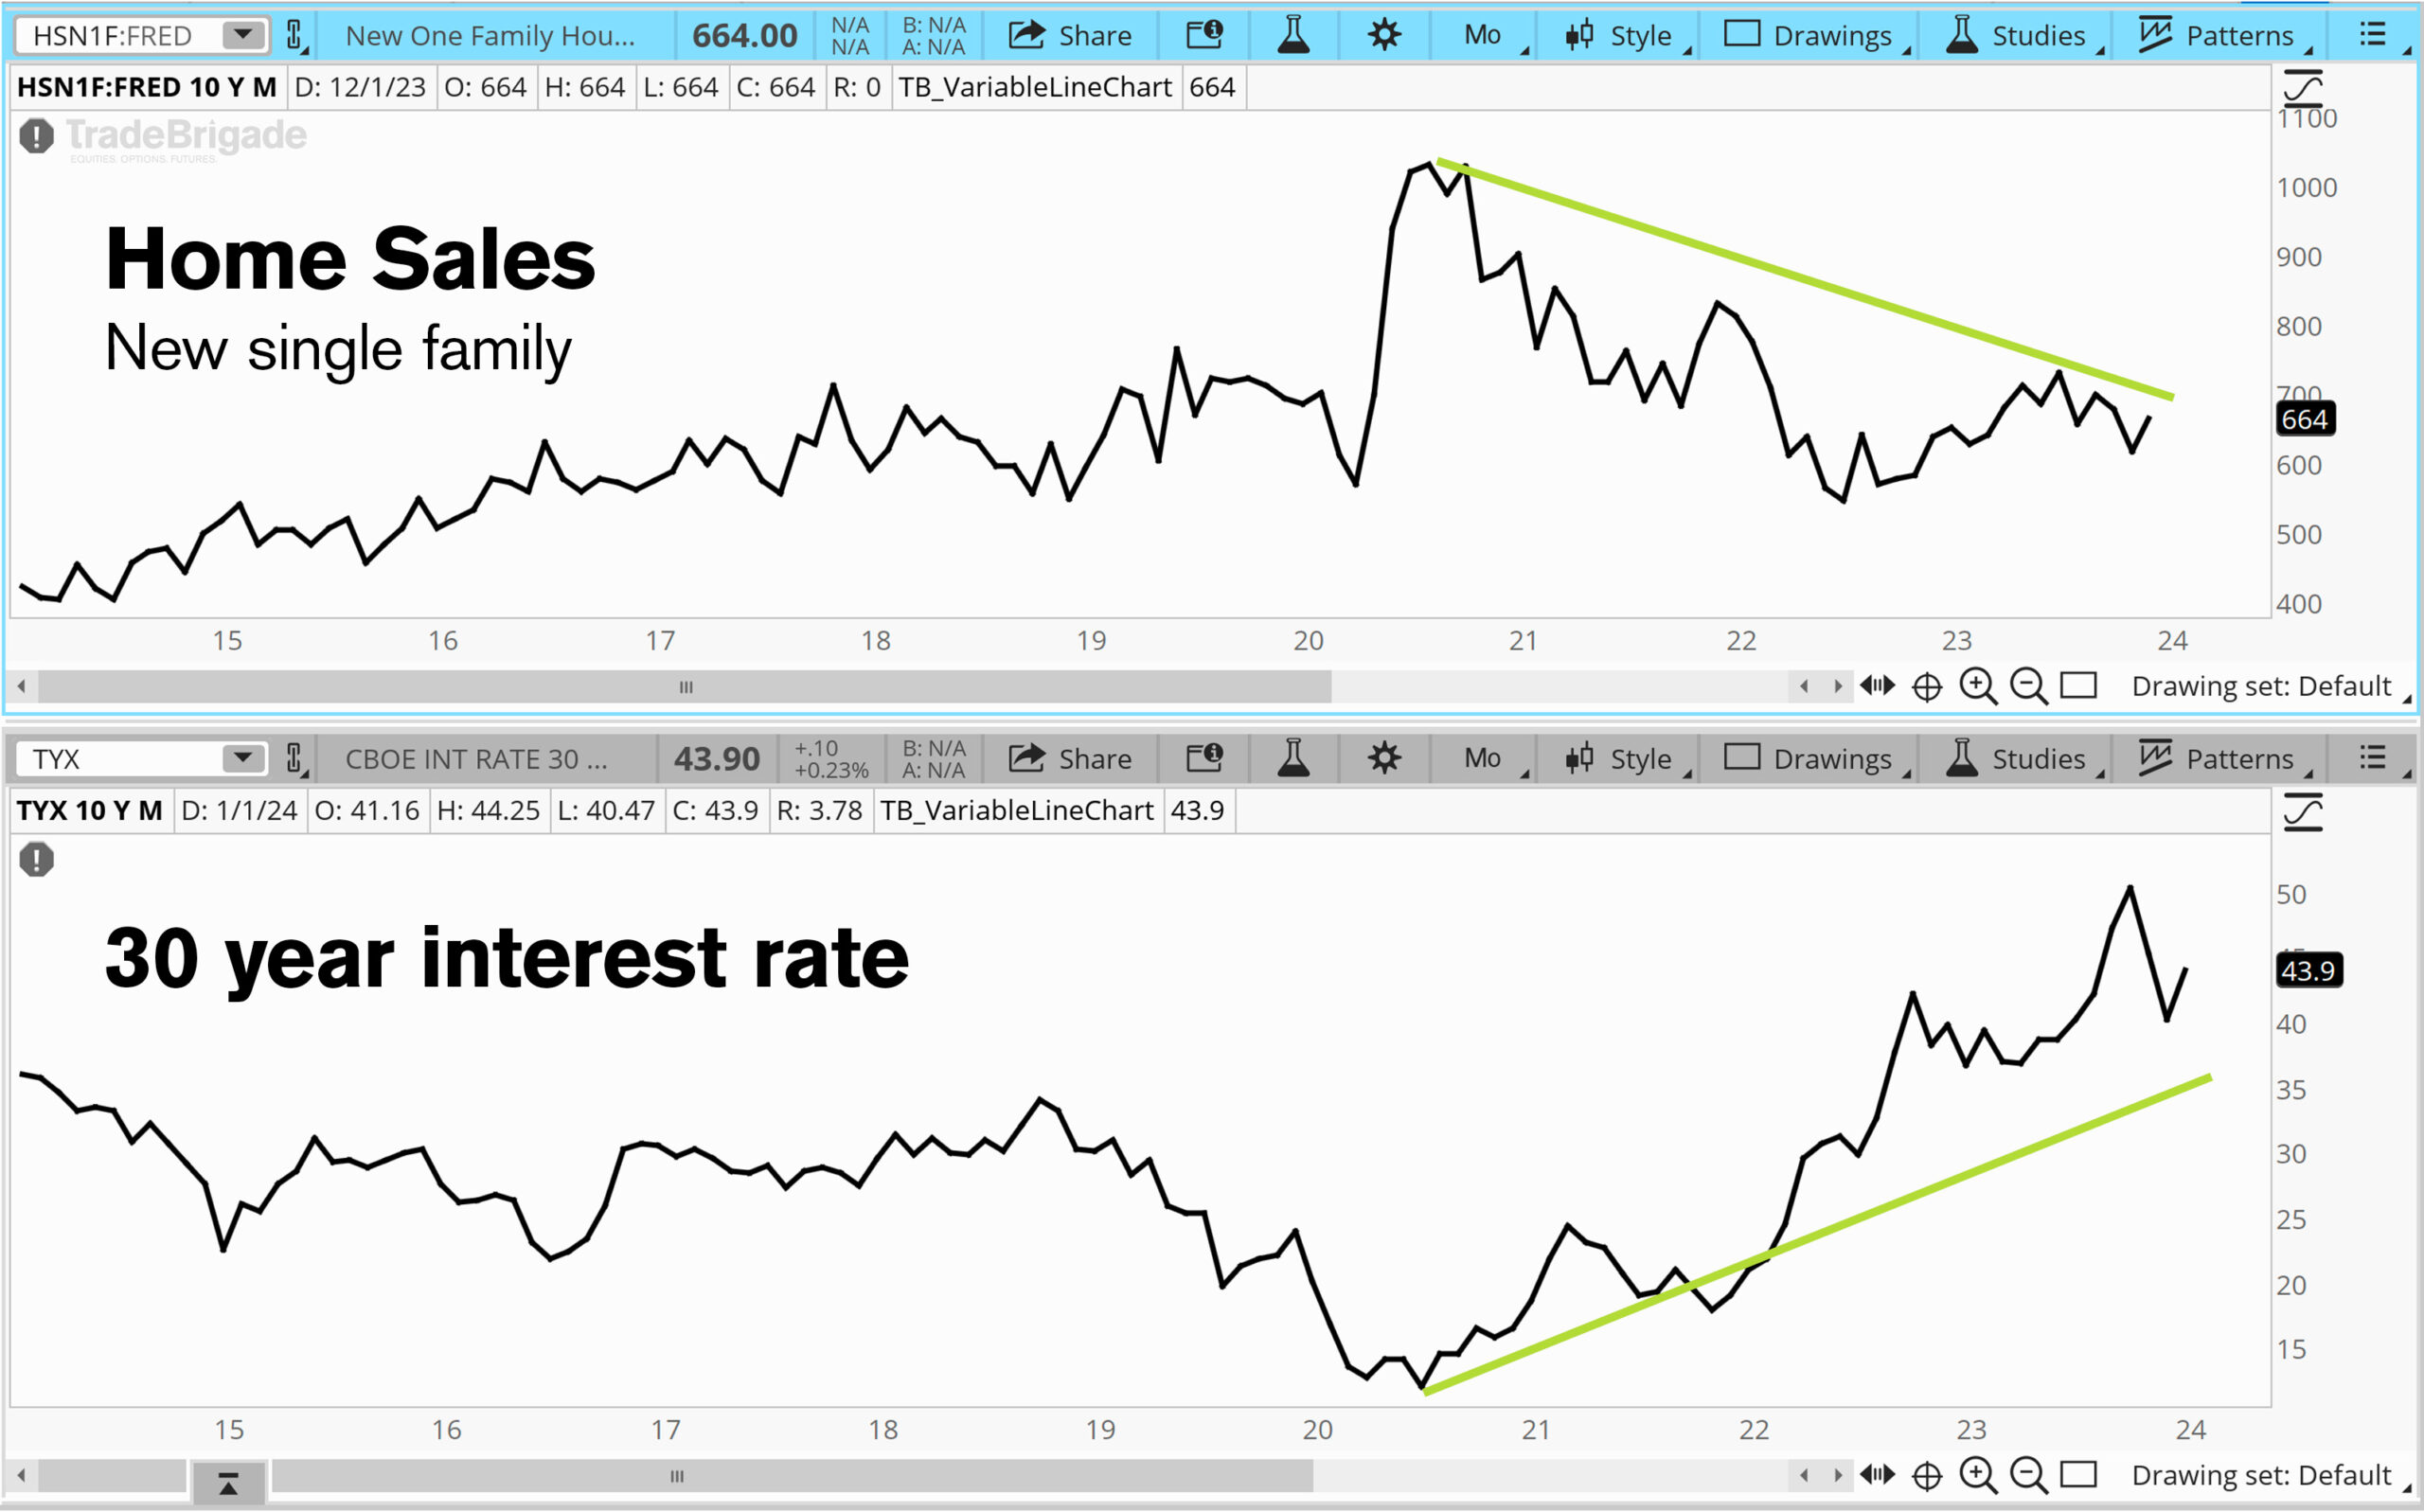
Rate cuts typically spur a cyclical expansion in manufacturing and residential construction as mortgage rates are closely tied to Fed policy. Even with higher interest rates, housing prices remain high due to low supply. The home buyers who locked in sub three percent rates will be hard pressed to sell even if the Fed were to cut all 150 basis points the futures are pricing in.
With a lack of existing homes available to fulfill the demographic demand from the Millennials, new home sales will be the only way demand can be met. New home sales have a greater impact on economic growth than existing home sales driven by additional ground up costs. Think structural design, engineering, construction and personalization. (Carson Group)
Rate Cuts
Jerome Powell won’t admit this in the public theater, but to achieve the dual mandate on price stability and maximum employment, he couldn’t have asked for better. The forward looking data on services inflation primarily via housing services and producer price index forecasts suggest inflation will continue to subside, and the labor market remains strong with a well educated cohort of participants ready to join.
Instead of thinking about how Powell implemented the fastest rate hiking campaign in modern history, we should be thinking about how he reset monetary policy at the fastest pace in modern history. The pandemic caused rates to immediately go to the lower effective bound of policy, and now they have moved back up to reflect a range where rates could be under the “new normal”… not to bring up a term everyone wishes was dead.
The Fed has acknowledged that a restrictive enough monetary policy has been achieved and from here they will remain data dependent in their quest to find neutral. GDP has not suffered despite Blackrock’s suggestion. One look at the actual GDP data suggests that growth has been robust in the post pandemic era after the kinks of the lockdown were sorted out. If GDP starts to slow to a point of stagnation, rate cuts can act as stimulus and encourage growth through demand channels. A similar response can be the result of early signs that the labor market is weakening.
The median rate projection from the latest Summary of Economic Projections suggests the Fed anticipates a maximum of three rate cuts in 2024. The Fed fund futures are suggesting that we see six rate cuts in 2024 bringing the Fed funds rate down to 375bps from 525bps.

Outside of a black swan event, we see the Fed aligning more so with their three cut forecast disregarding the market’s expectations. This would be a much more appropriate response to easing inflation. Take for example the 1994 hiking cycle where interest rates nearly doubled from three to six percent in an effort to cool off a hot economy. In 1995 and 1996, the Fed cut rates by 75 basis points in response to successfully slowing things down. It is one of the only cycles with lift off speed similar to the 2022 hiking campaign that did not also result in a recession. Three well placed 25 basis point cuts in 2024 could yield a similar soft landing result.
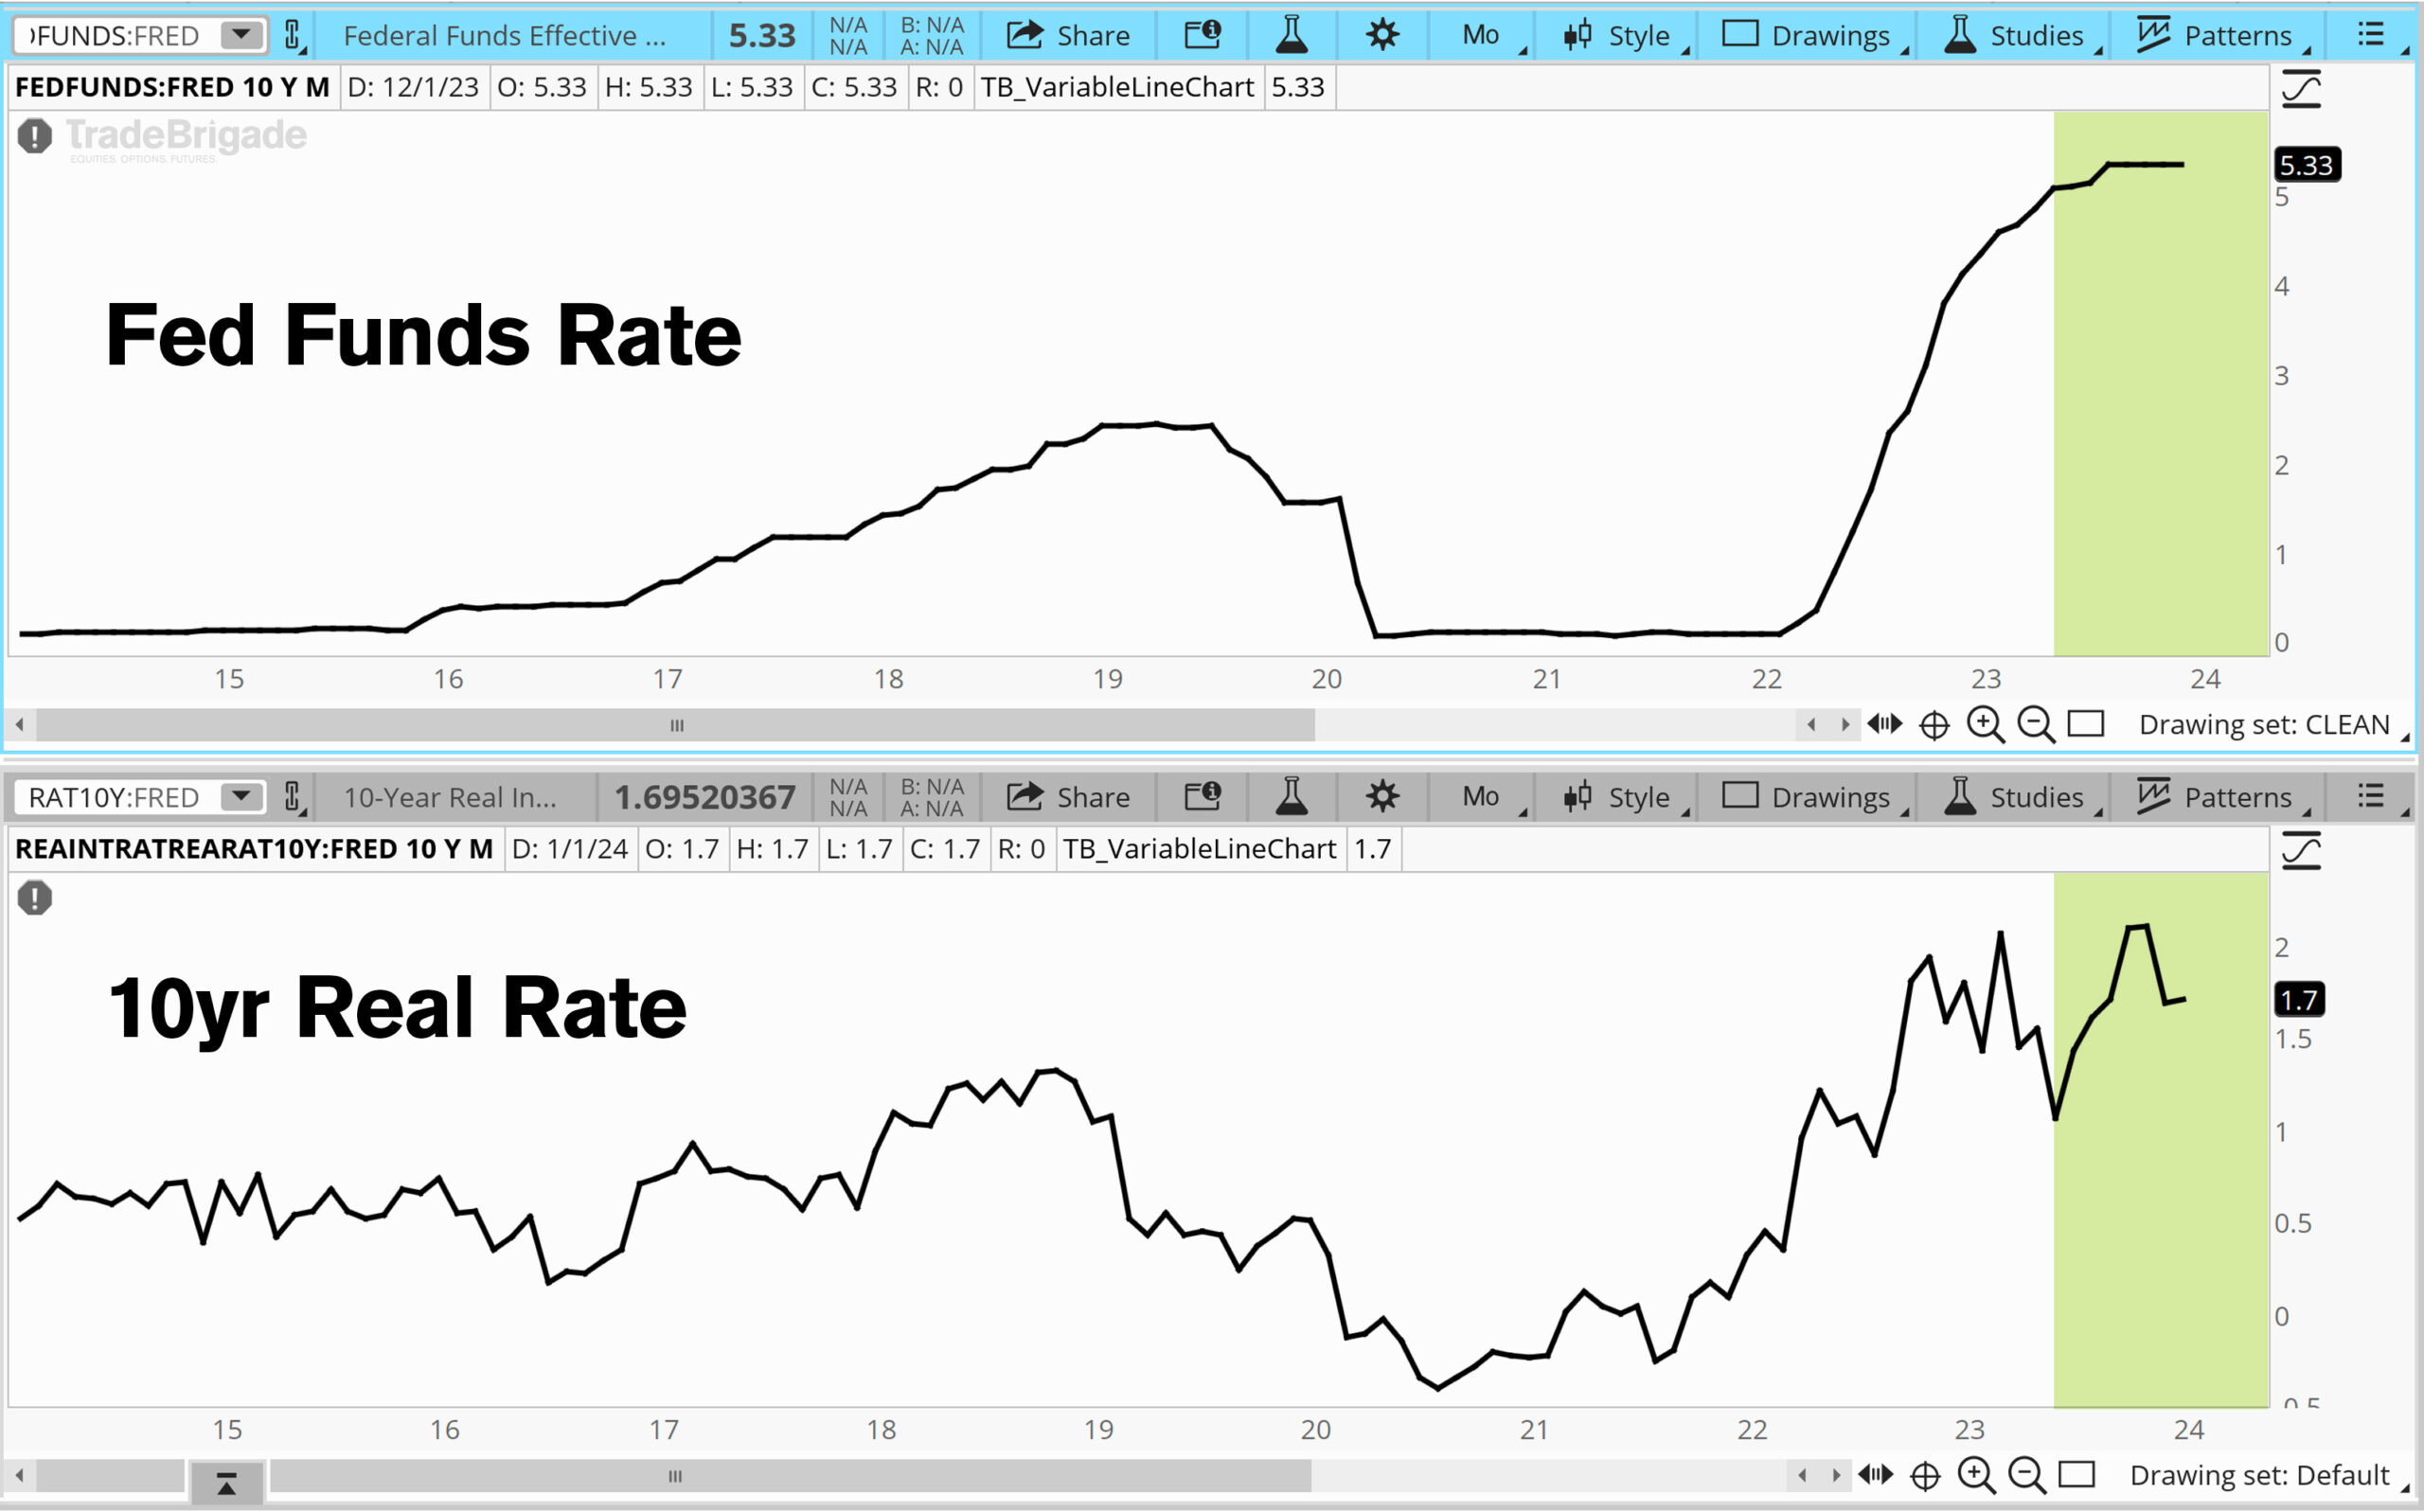
As interest rates remain stable and high, and inflation continues to fall, real rates technically rise. Without explicit Fed fund rate hikes, monetary policy continues to get tighter. To avoid becoming too tight based on real rates, we can see the Fed cutting the aforementioned three times as outlined by the SEP to counterbalance over tightening risks.
If The Promise Is Broken
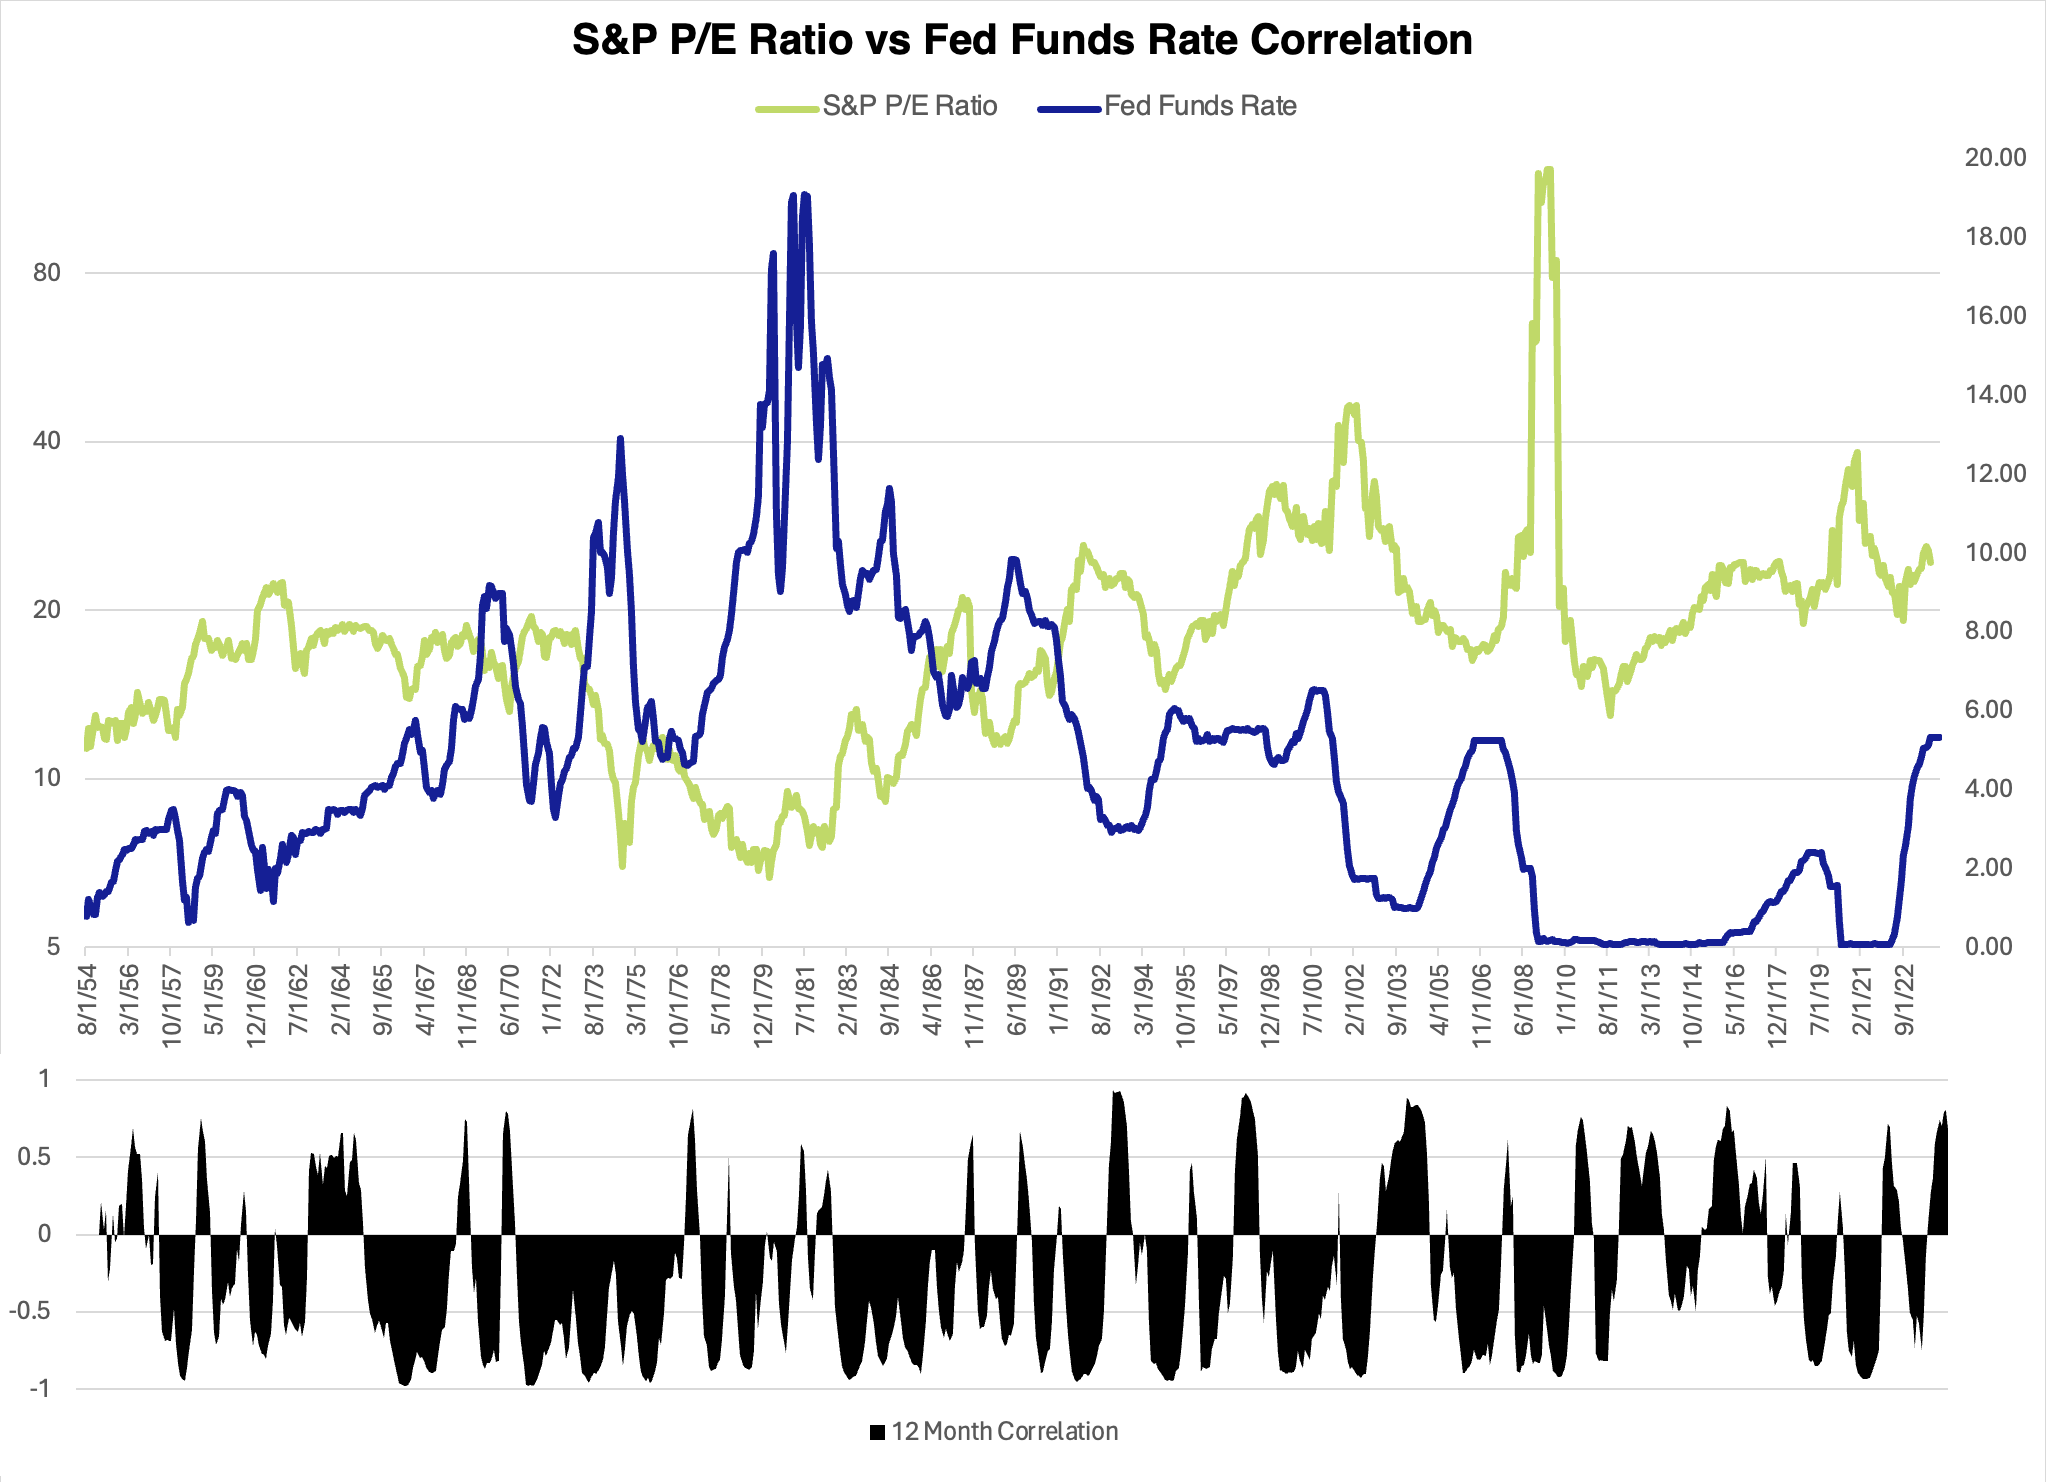
A year of no rate cuts spells trouble for equity markets as the justification for the rally we have seen primarily from the October 2023 lows evaporates. The Q4 advance in equities is largely based on a multiple expansion and not strong earnings growth. As illustrated below, the P/E multiple of the S&P 500 mostly has a negative correlation with the Fed funds rate and positive correlations don’t last long.
So if the earnings multiple is potentially going to contract on a broken promise, earnings estimates need to rise substantially to justify current prices. At the time of this writing, the S&P sits around 4900 with a P/E around 20 and an EPS of about $243. Prices are within striking distance of that valuation. If the P/E ratio falls by one point suddenly we need blended earnings for the year to hit 258 to continue the justification of 4900. ($4900 SPX / 19 PE = 257.9 EPS) Earnings expectations are usually revised lower as the year goes on, so let’s have a look at 2024 expectations.

We can see that estimates are trending downwards as they typically do. Over the past 25 years (1998 – 2022), the average difference between the bottom-up EPS estimate at the beginning of the year (December 31) and the final EPS number for that same year has been 6.9%. Analysts tend to overestimate the final EPS number by 6.9% one year in advance. (Factset)
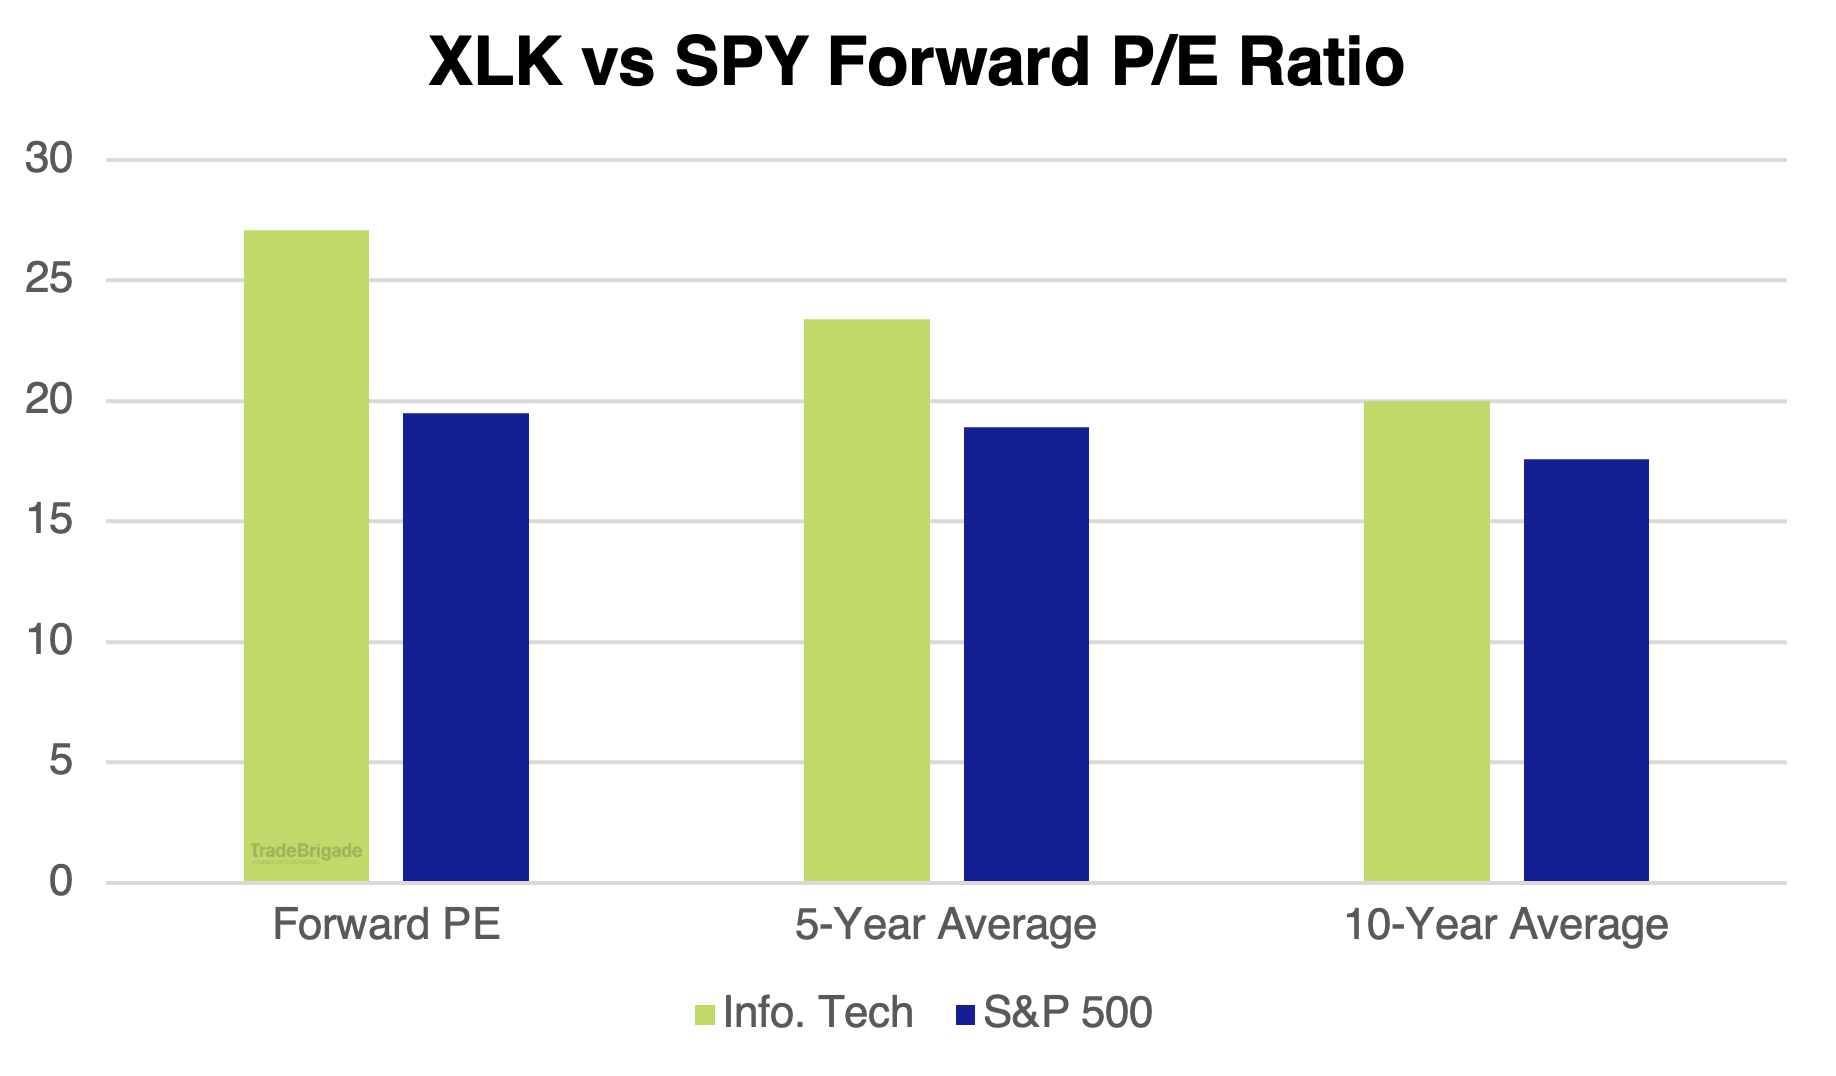
If this plays out, the end of year EPS drops to 229.25, giving us a S&P valuation of 4585 based on the 20 PE ratio. That’s not including any potential reversal in P/E expectations to reflect the possibility of no cuts. A 229.25 EPS with a 19 PE gives us something in the neighborhood of 4350. On the contrary if we see 229.25 EPS become a reality but the market does not move lower, the P/E would have to expand further to 21.37 to justify 4900 SPX. Without the promise of rate cuts being fulfilled, this seems unlikely and would suggest a historically expensive S&P. The current P/E ratio is above the 5-year average of 18.9 and above the 10-year average of 17.6.
A Look At The Technicals
This couldn’t be a Trade Brigade publication without the technicals! Let’s have a look at SPX to identify inflection points. Monthly time frame charts unless otherwise noted.
Base Case
As a base case let’s assume a soft landing and that the promise of cuts and AI are fulfilled in 2024.
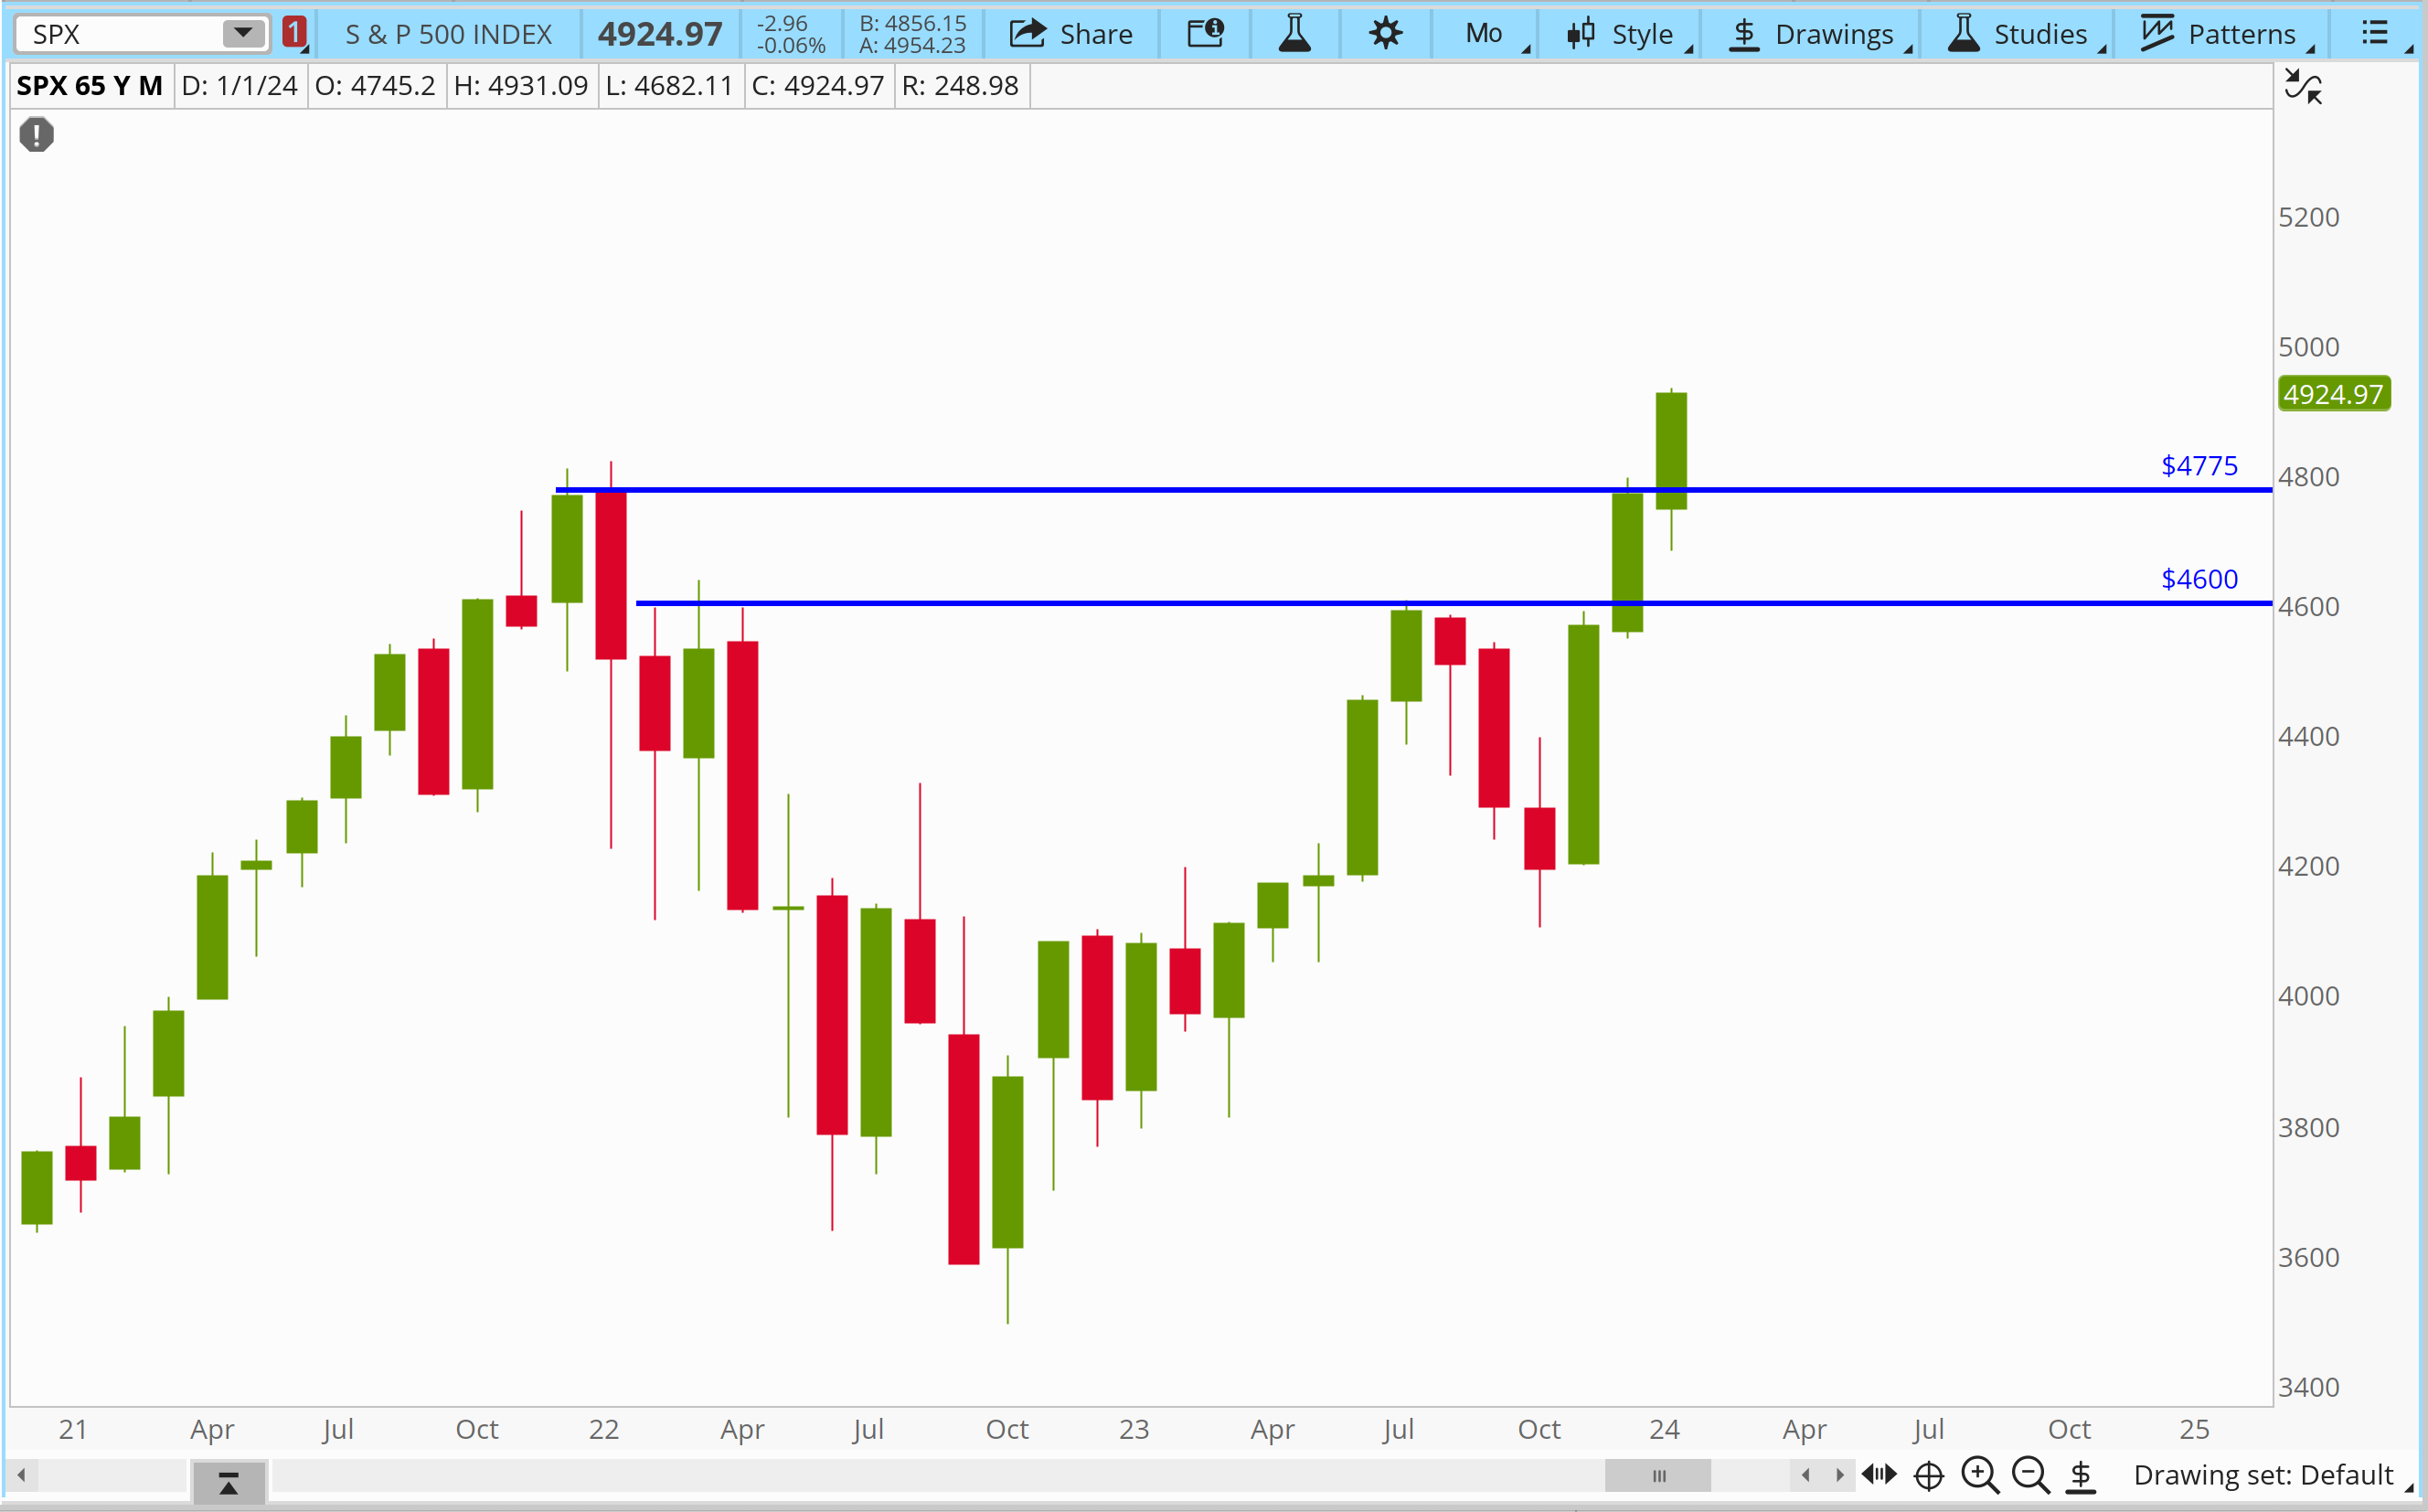
The first chart illustrates the breakout over all time highs in January and how even a deeper pullback can find a monthly higher low near 4600 to remain in an uptrend.
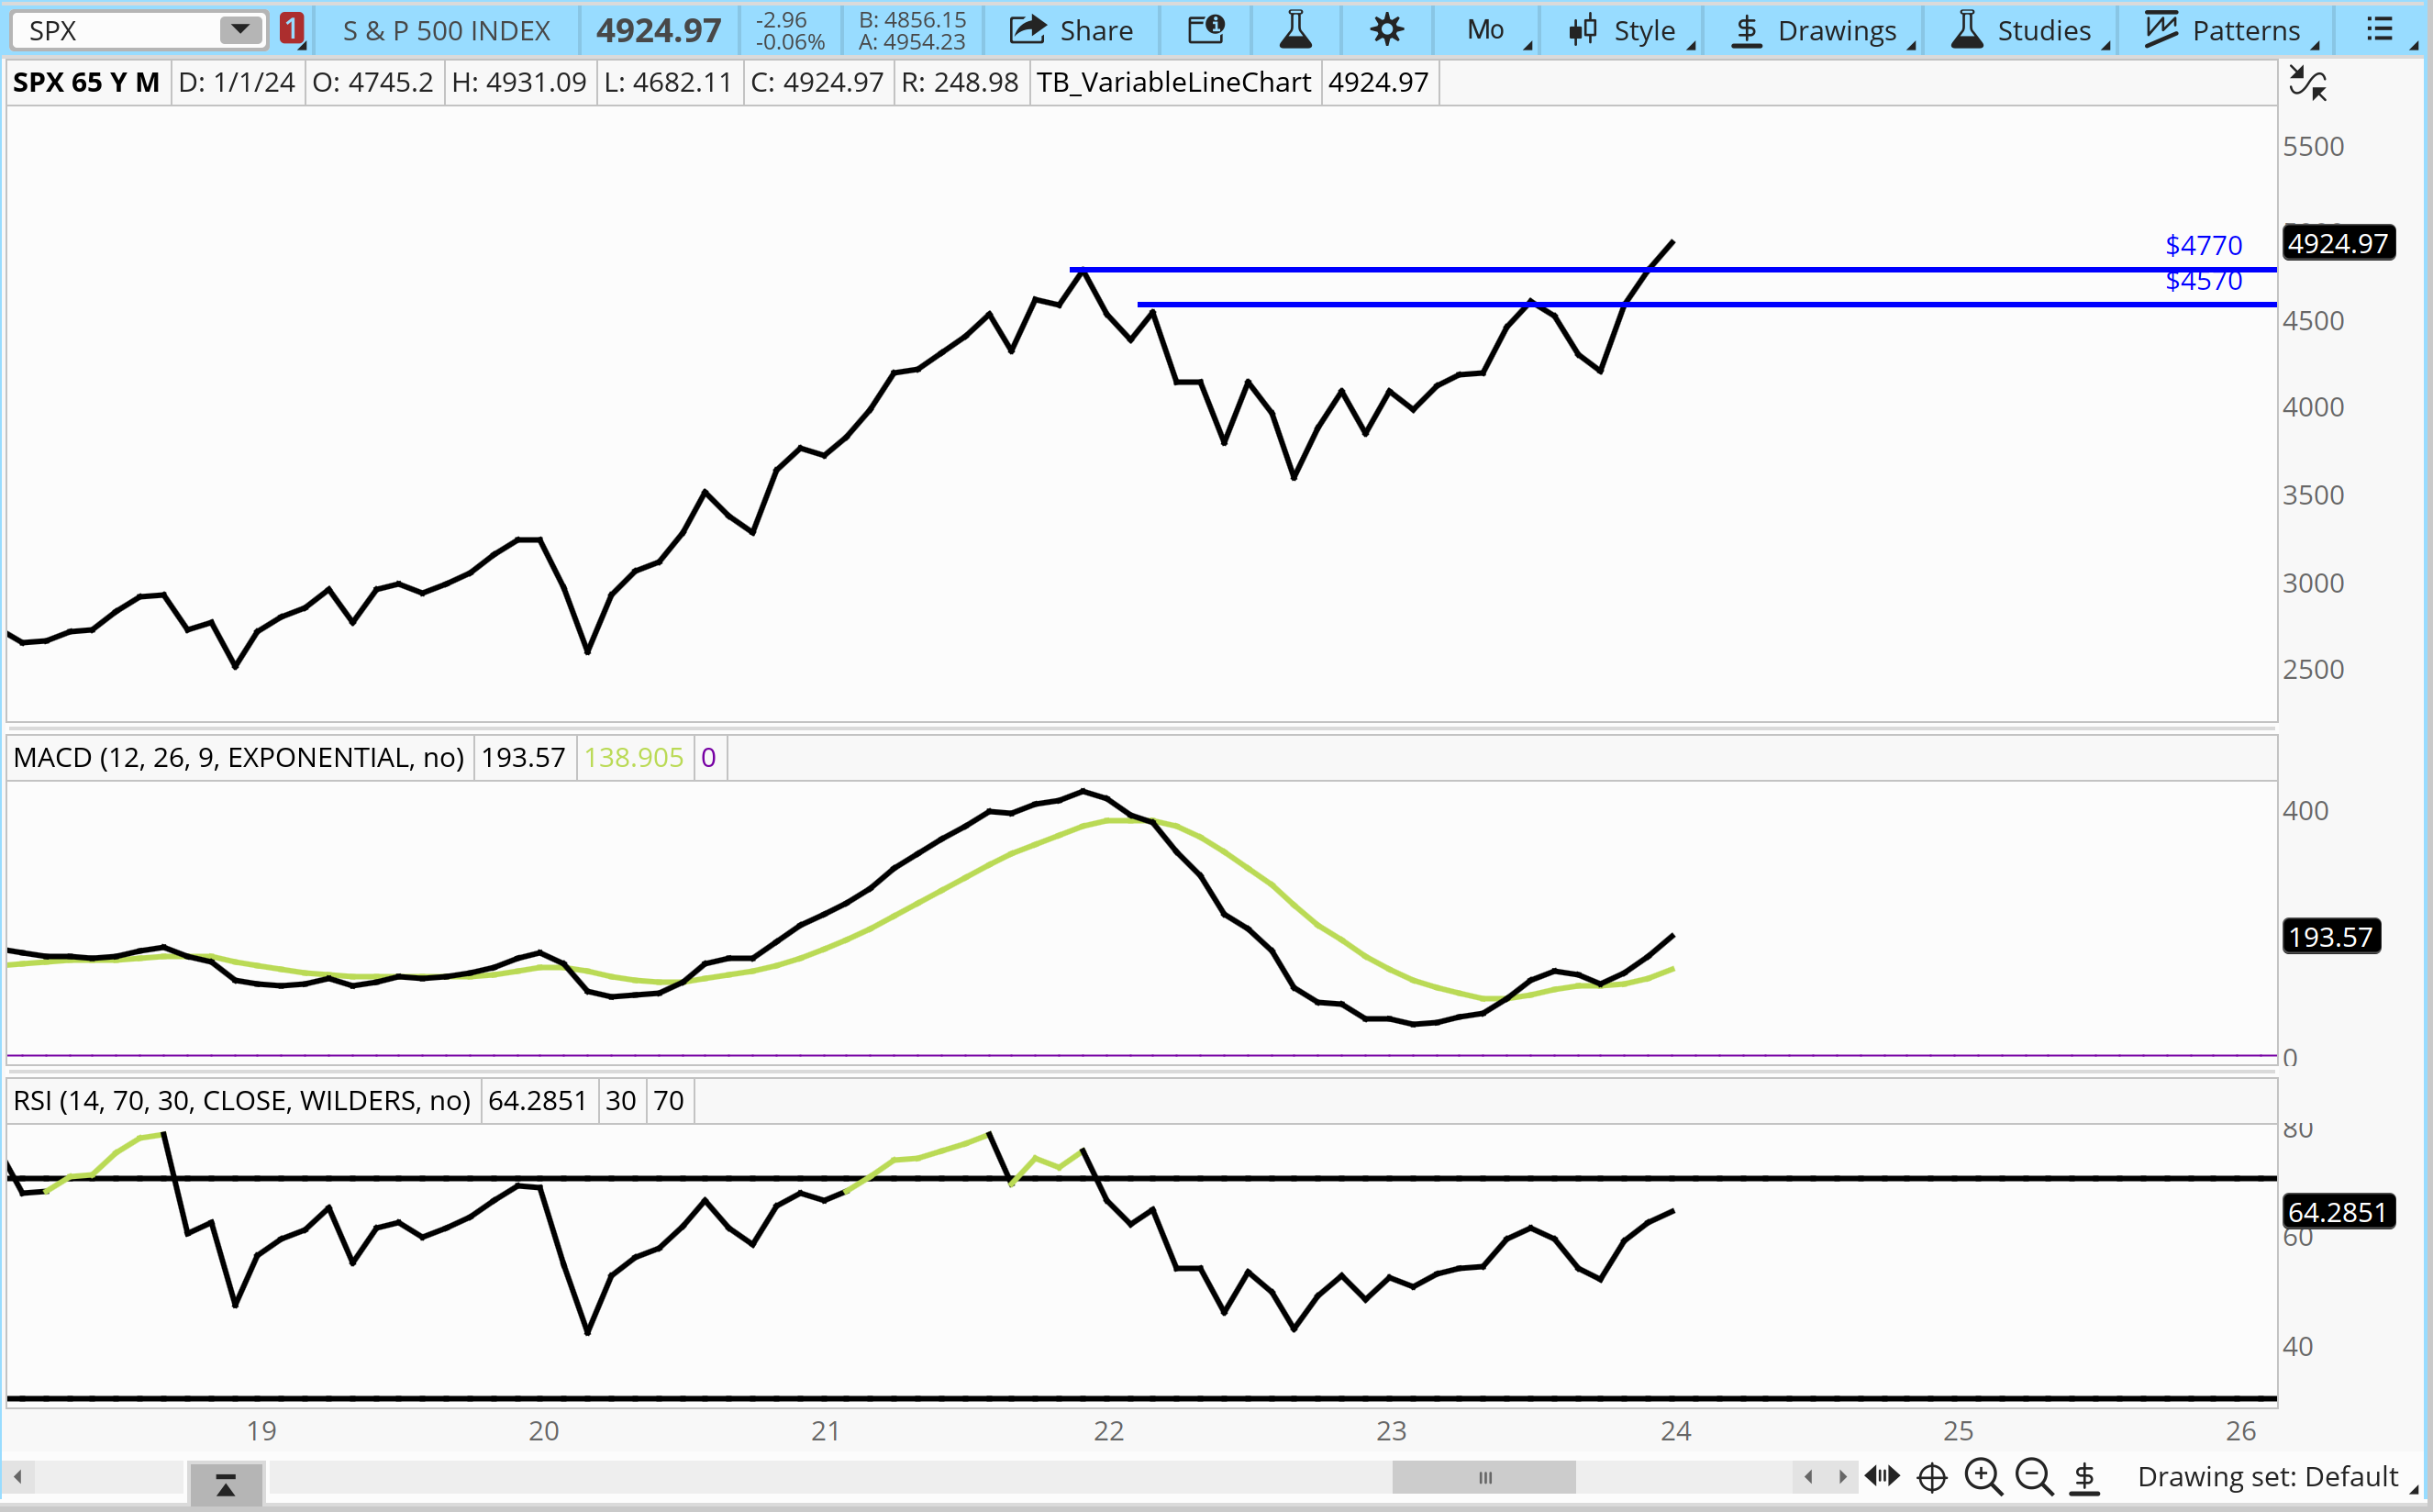
Secondly, on the breakout over the all time highs, we have positive momentum indications in both the MACD and RSI. The MACD is above the signal line with a higher low and above 0. The RSI is above 50 and not in overbought territory.
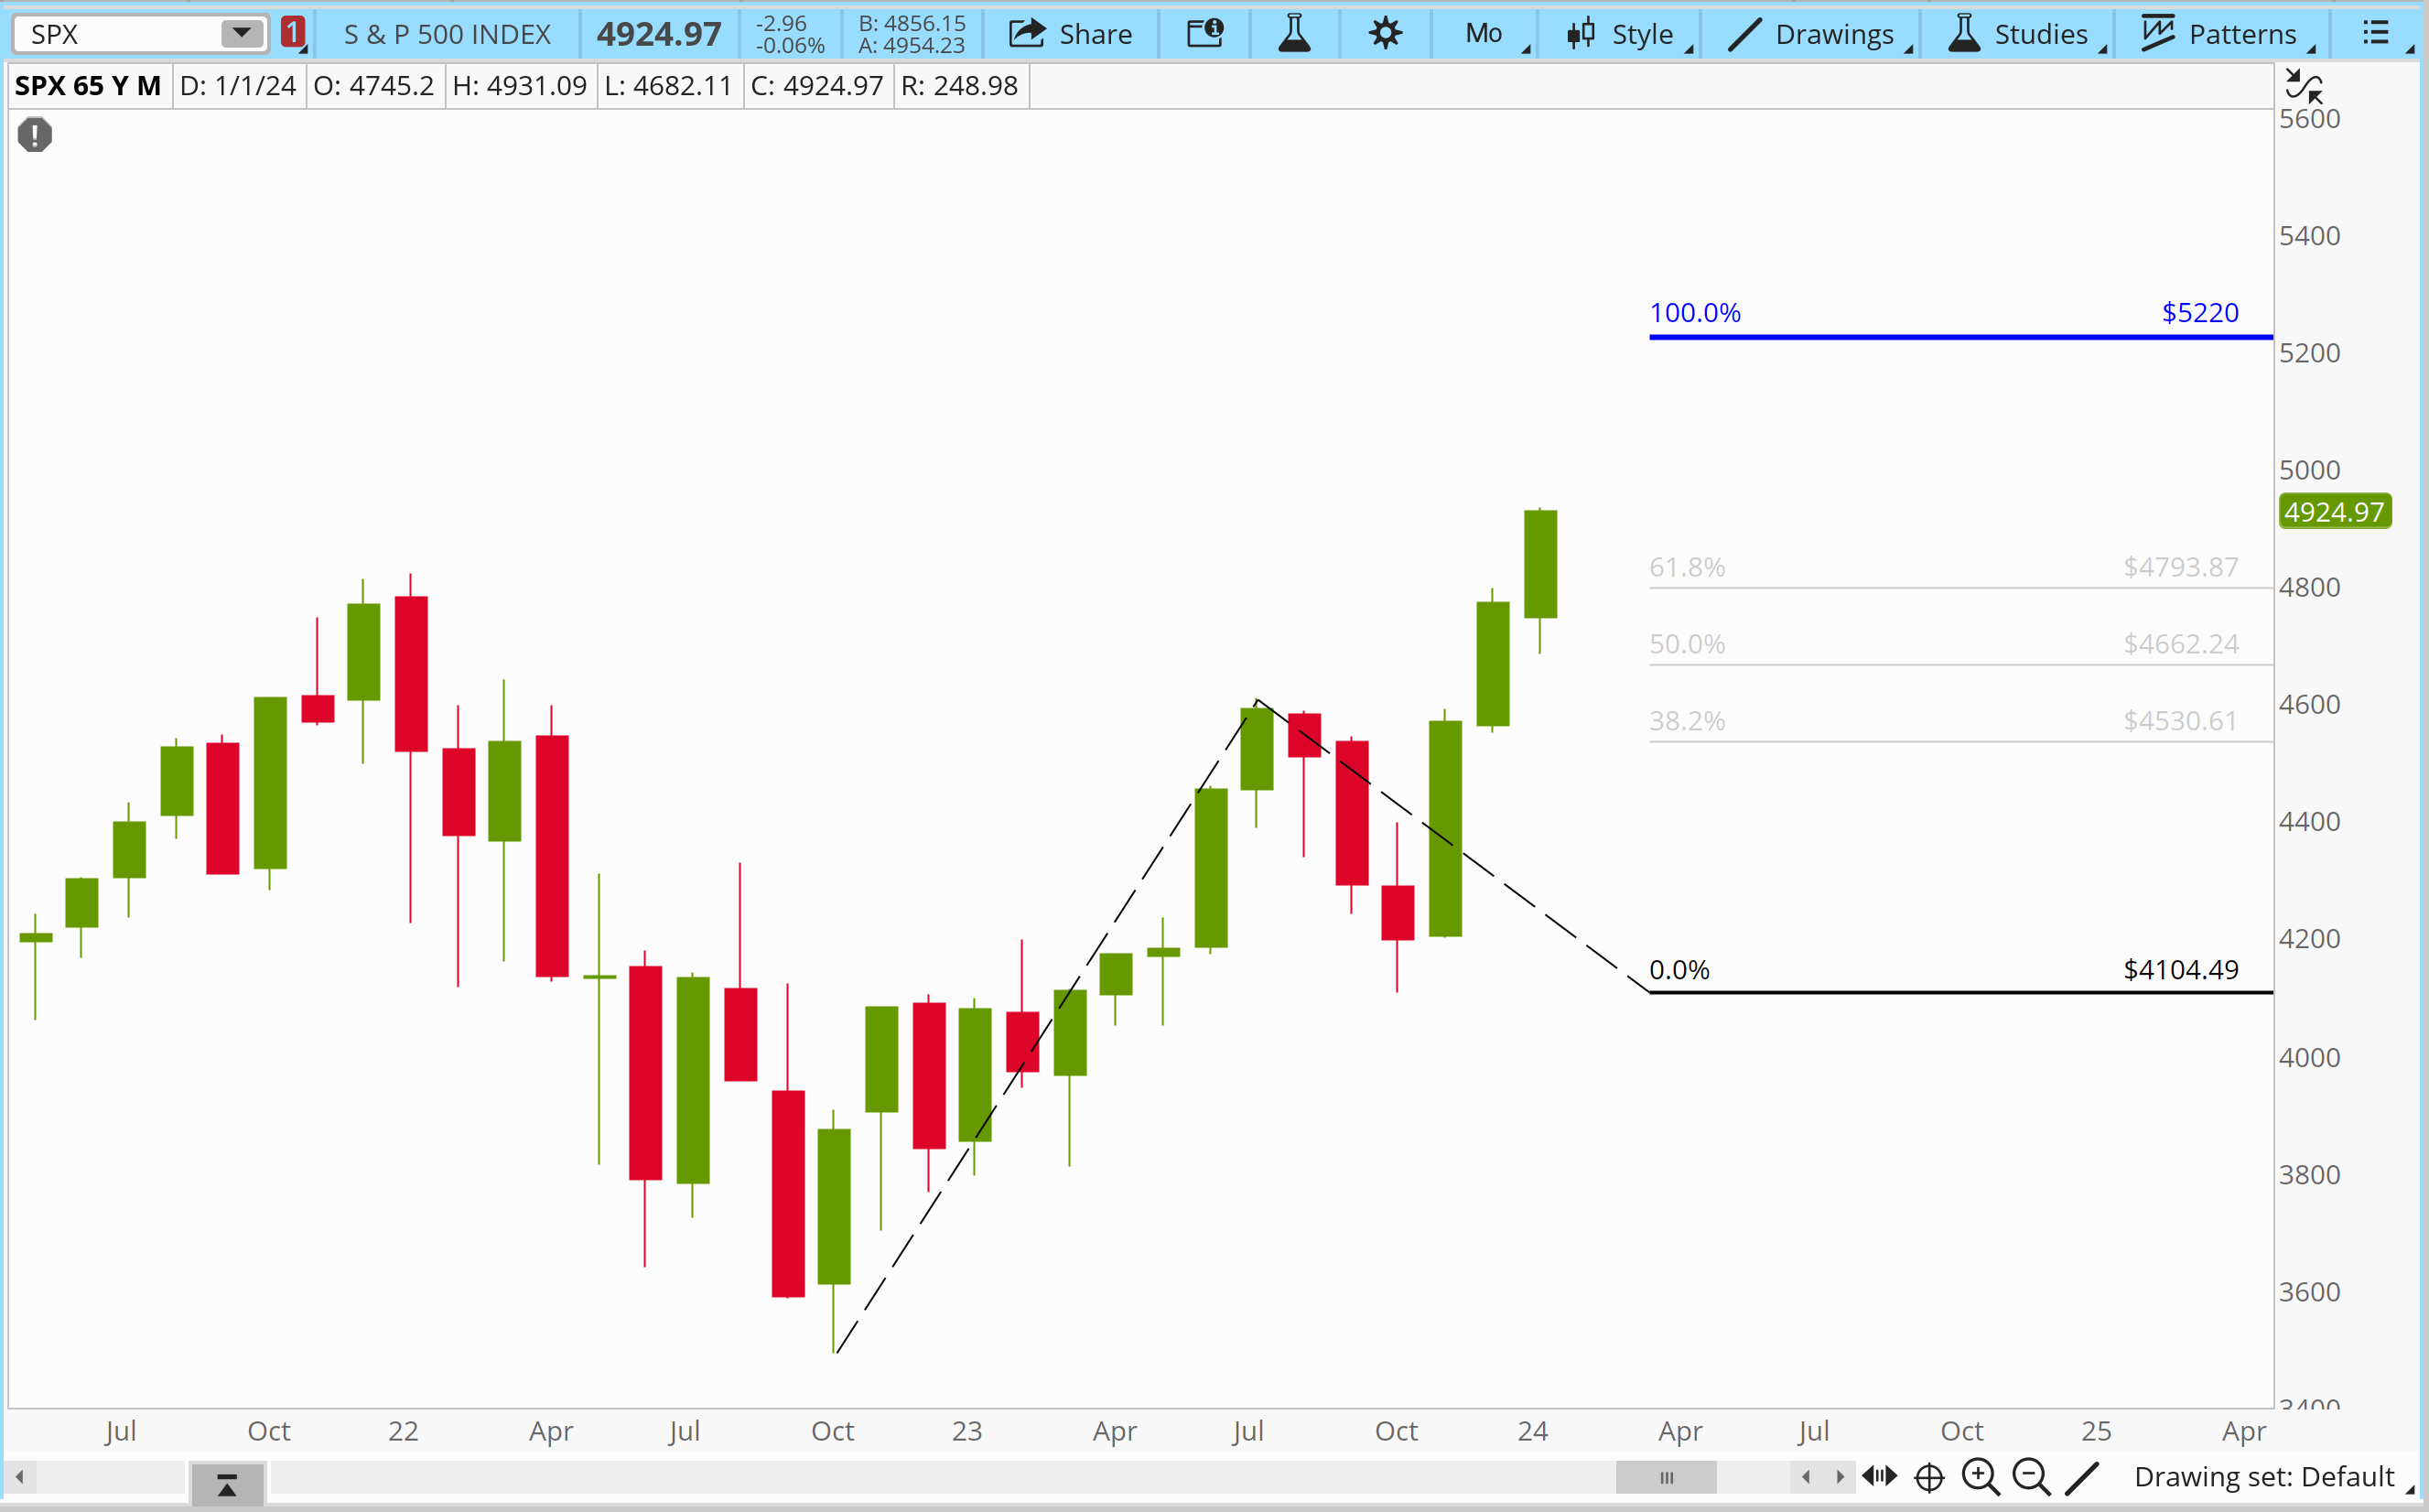
Thirdly, the monthly timeframe cup and handle suggests a measured move towards 5200. If that becomes a reality, 2024 would return roughly nine and a half percent from the close of December 2023.
This is a yearly time frame chart to illustrate the three year balance that we have started to break out of in 2024. Using very classic range doubling rules, a projected move takes us to 5950, even further than the cup and handle from above.

Broken Promises
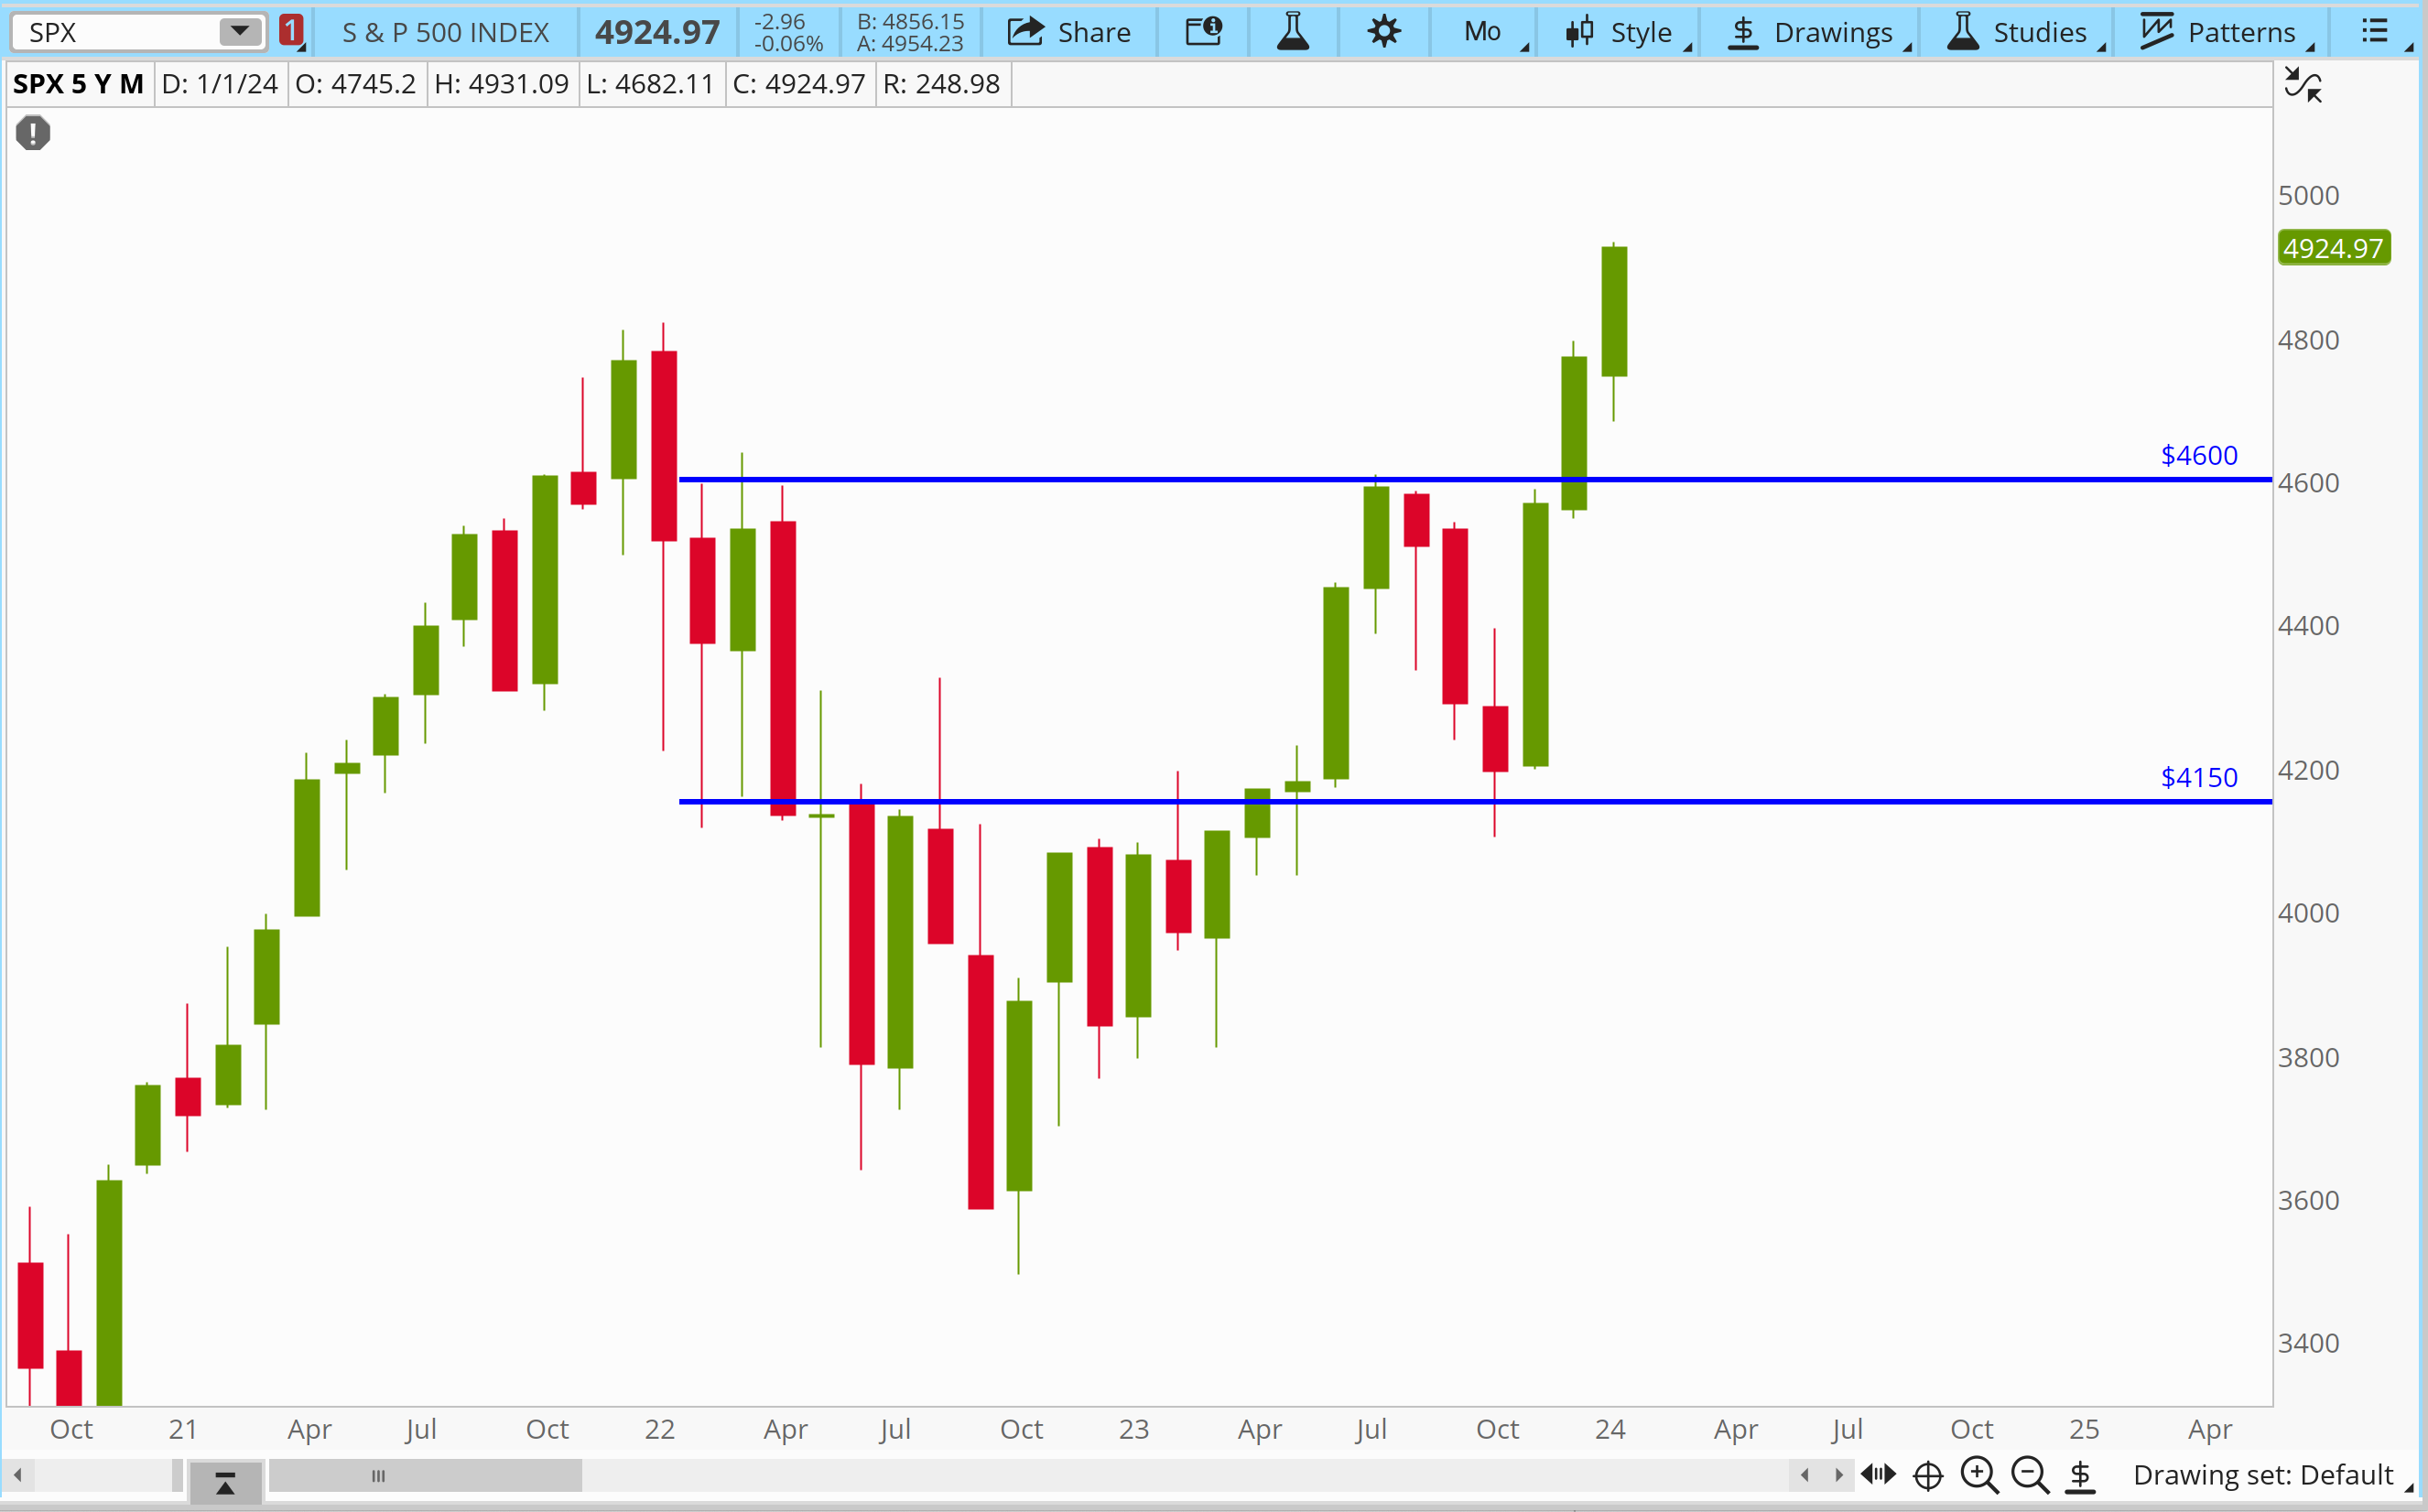
In the case of broken promises, we can see a stagnant S&P digesting the gains that were posted in 2023. A failure of the monthly higher low at 4600 could yield consolidation but likely to stay above 4150. Our technical view is that such a base was built between April 2022 and April 2023 that buyers will defend that location or new money longs will look to add in that location.
Switching to a SPY monthly here to get the VWAP (blue dashed line) anchored to the Covid plunge low. Over time this will provide confluence with the 4150 level and act as support on deeper consolidation. Bollinger bands in green and black show the possibility of being overbought at the upper bound. As you can see during the Covid recovery, this was not a compelling metric to short the market.

The highest volume node that we have in the price action after making a new all time high beyond the pre Covid high is also aligned with 4150 acting as possible support.

Conclusion
Inflation is falling meaningfully. The labor market remains robust. Demographics support a productive workforce. The era of AI will be a positive catalyst for small and large companies. Rate cuts are likely coming, but perhaps not to the magnitude of what participants expect. Markets remain in technical uptrends on all time frames with plenty of reference points offering higher low opportunities.
Our base case is for the outline above to remain true through 2024. As mentioned in the introduction, the point isn’t necessarily to get it exactly right, but rather identify when and where changes take place and how we can manage against the base case.
For now, we are overweight US equities with a preference for remaining long preexisting growth positions, adding to value positions, and building small cap positions. India would be our preference for developing markets, however our view is that the US will continue to outpace global equities in 2024.
With no flight to safety and immediate indication of recession, we are tactically underweight fixed income to avoid opportunity cost in US equities.