2023 US Financial Markets Outlook
Calendar Year Performance 2022 Snapshot
| S&P 500 (SPY): -20% | Gold (GLD): +0.3% |
| Nasdaq (QQQ): -33% | Bitcoin (BITO): -64% |
| Russell 2000 (IWM): -22% | U.S. Dollar (UUP): +8% |
| Vanguard Total Bond Market Fund (BND): -14% | Commodities (CRB Index): +20% |
2023 Forecasts From Wall Street
| Deutsche Bank: 4,500 | Goldman Sachs: 4,000 |
| Wells Fargo: 4,300 to 4,500 | BofA: 4,000 |
| BMO: 4,300 | Citi: 3,900 |
| Jefferies: 4,200 | UBS: 3,900 |
| JPMorgan: 4,200 | Morgan Stanley: 3,900 |
| RBC: 4,100 | Societe Generale: 3,800 |
| Credit Suisse: 4,050 | Capital Economics: 3,800 |
| HSBC: 4,000 | Barclays: 3,675 |
Due to the many factors that must be considered and the unanticipated events that may occur, accurately predicting the stock market’s movement for the coming year is a very difficult task. Wall Street strategists continuously refine their predictions when new information becomes available. A large number of the predictions cited above are updated versions of older forecasts.
The point of this publication is not to precisely pick the exact closing print of the S&P 500 in a year. Instead a discussion of the major themes present in the market that are providing headwinds and tailwinds provides more insight. Once identified, we can assess the conditions that would favor either market improvement or market decline. To understand what the future may hold, we must first understand the past.
Setting the Stage
After the euphoric rallies of 2020 and 2021 fueled by unlimited quantitative easing, 2022 brought anguish to investors and traders alike, with a tumultuous transition to restrictive monetary policy ushered in by the Federal Reserve. As market participants of all time frames adapt to this paradigm shift, it is vital we maintain the resolve to capitalize on opportunities traditionally observed after historic periods of drawdown. Turning the calendars for the new year presents a moment to reflect on the market’s current troubles, and the probabilities that those troubles are resolved in the near future.
Expecting further turbulence is the consensus forecast for the first half of 2023 as global markets continue to reluctantly digest new macro trends. Inflation encompasses the three themes that have been identified as macro issues coming into 2022 and remain persistent into 2023. Firstly, inflation of equity and bond prices made them historically expensive based on valuations. Second, lagging monetary policy to tame goods and services inflation also means lagging effects to the equities market. Lastly, inflationary protagonists are being exacerbated by declines in labor force participation alongside the unraveling of a connected global economy.
Continuously asking if any of these inflationary issues have been abated as we navigate 2023 will allow us to remain flexible in our view of the market and thus allocations to certain asset classes.
Inflation of Equities & Bonds – Prices Too High
Beginning 2022 equities and bonds were priced at historically one of the highest valuations as reflected in the Shiller PE index as well as the US 10 year yield (Figure 1).
 Figure 1: Shiller PE (green) vs US10Y (blue).
The Federal Reserve’s unlimited quantitative easing policy in reaction to the threat of global shutdown in 2019 inflated the balance sheet driving risk on behaviors with rates also floored at 0-25bps (Figure 2).
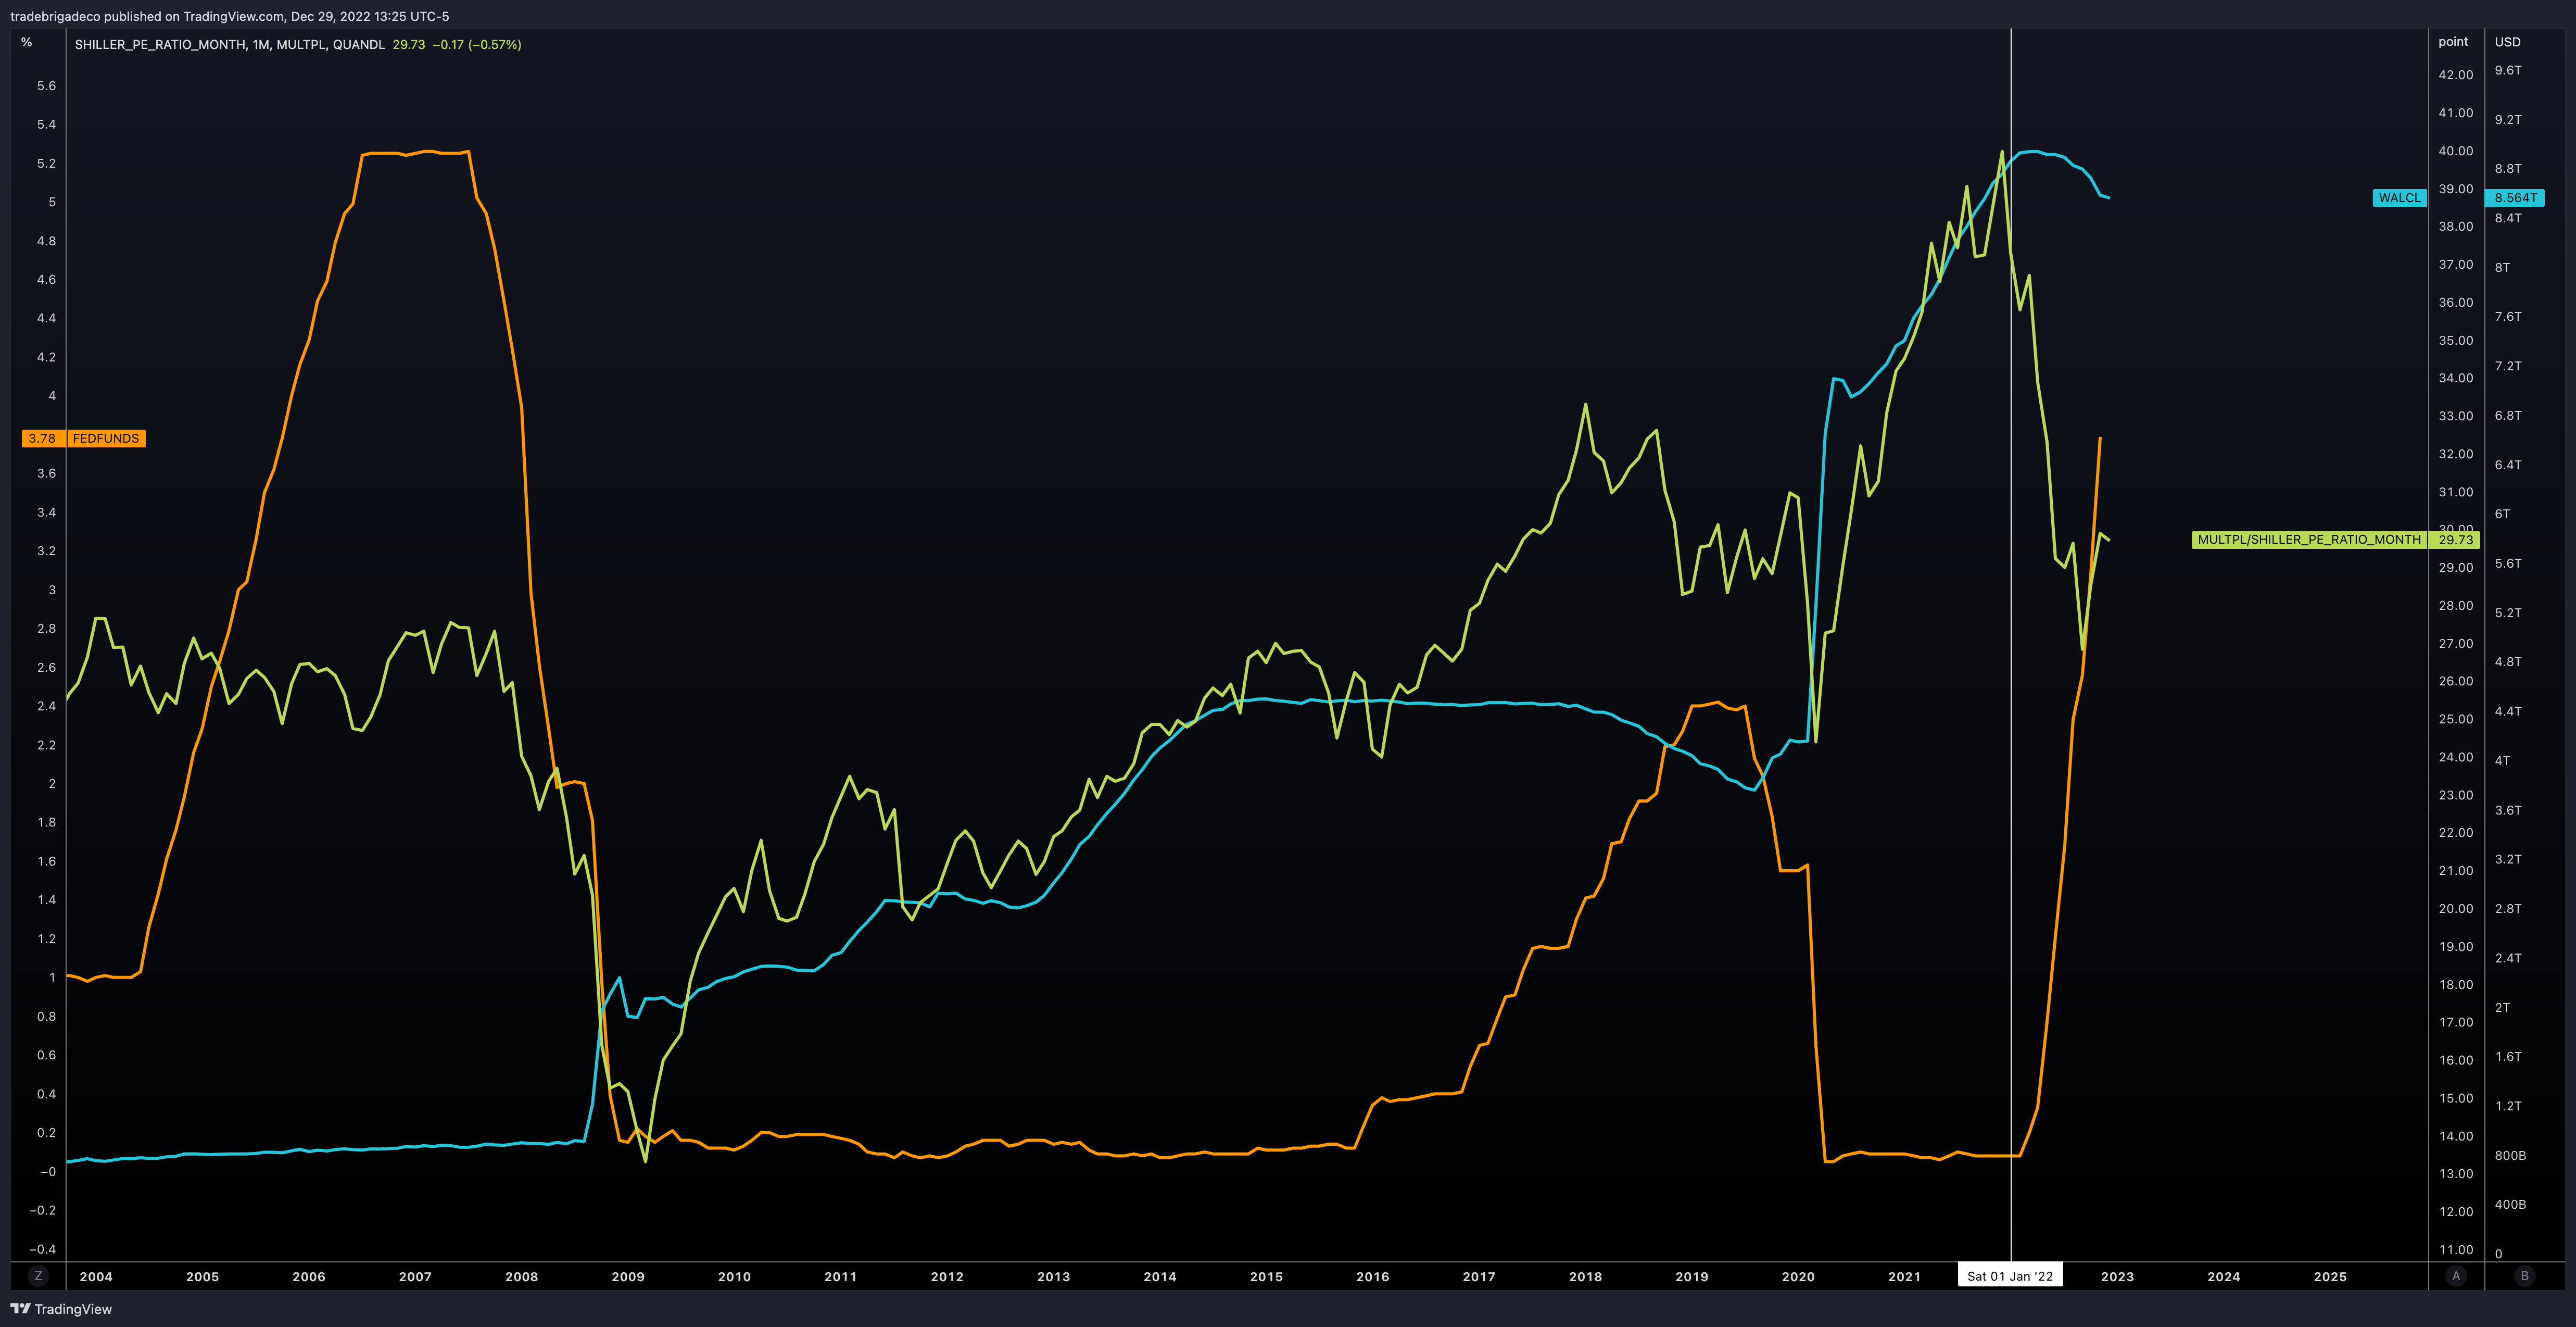 Figure 2: Shiller PE (green) vs Fed total assets (blue) vs Fed funds rate (orange)
The easiest place to see the aggression in risk taking behavior based on the Fed’s easy money policy was in the subset of mid-large cap companies who were not profitable, but went on to have more than 200% rallies over the course of 2020-2021 (Figure 3).
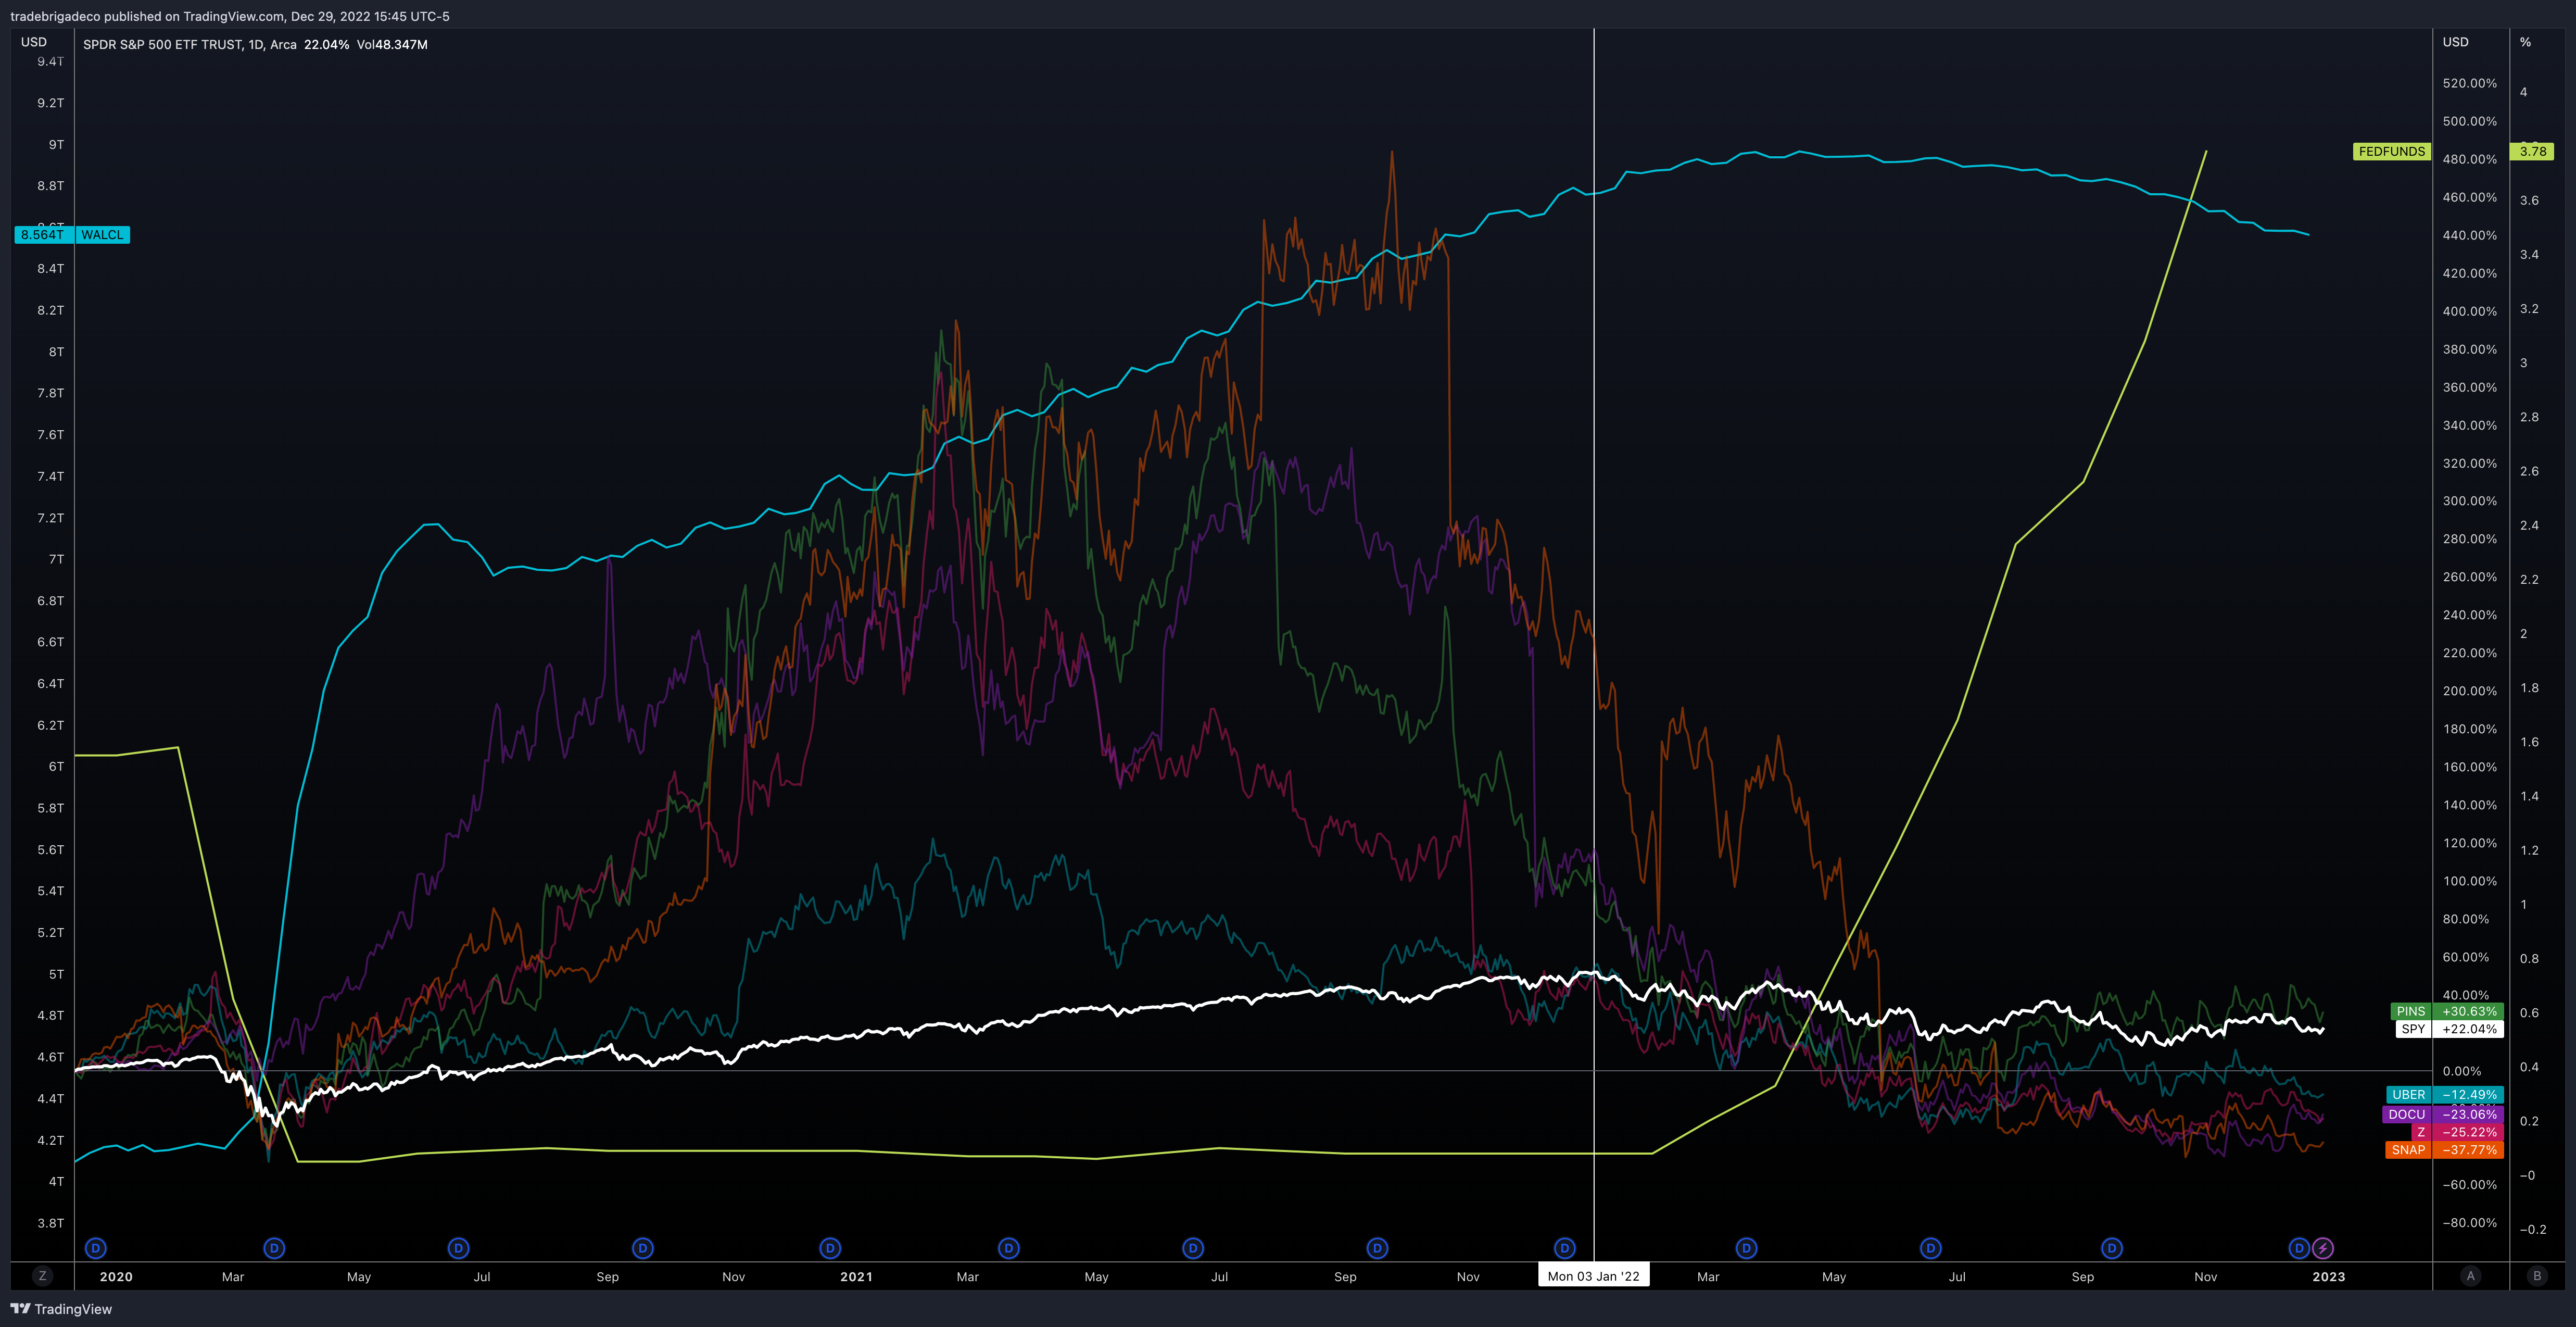 Figure 3: S&P 500 (white), Fed total assets (blue), Fed funds rate (green). Companies listed – Pinterest, Uber, Docusign, Zillow, Snapchat
With 2022 marking the beginning of the end of unlimited quantitative easing and a transition to quantitative tightening, there has been some compression of the earnings forecasts but the question remains, is it enough compression? Roughly one third of companies in the S&P 500 have seen cuts to earnings estimates greater than 10%, leaving room for additional deep cuts to smother earnings outlooks (Figure 4).
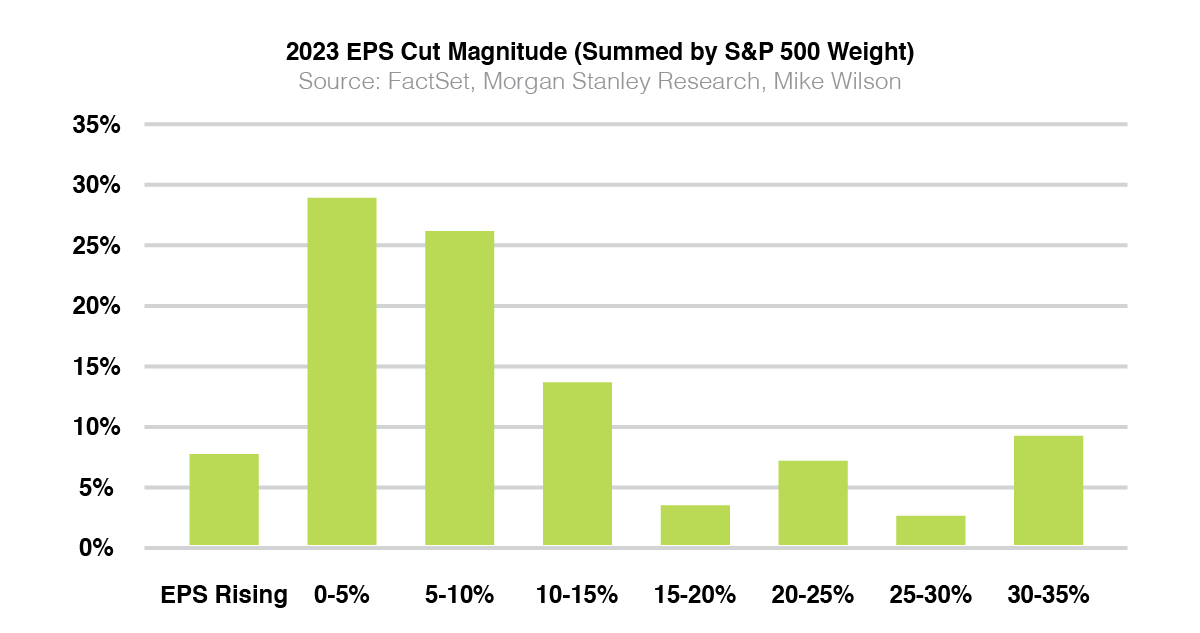 Figure 4: EPS Cut Magnitude
This forecast of further cuts has higher odds of becoming a reality in a recessionary environment. Looking at classic recession indicators like the 10-2 year yield inversion and the Conference Board LEI, paired with the Fed’s mission to muffle demand, a recession is seemingly imminent (Figure 5 & 6).
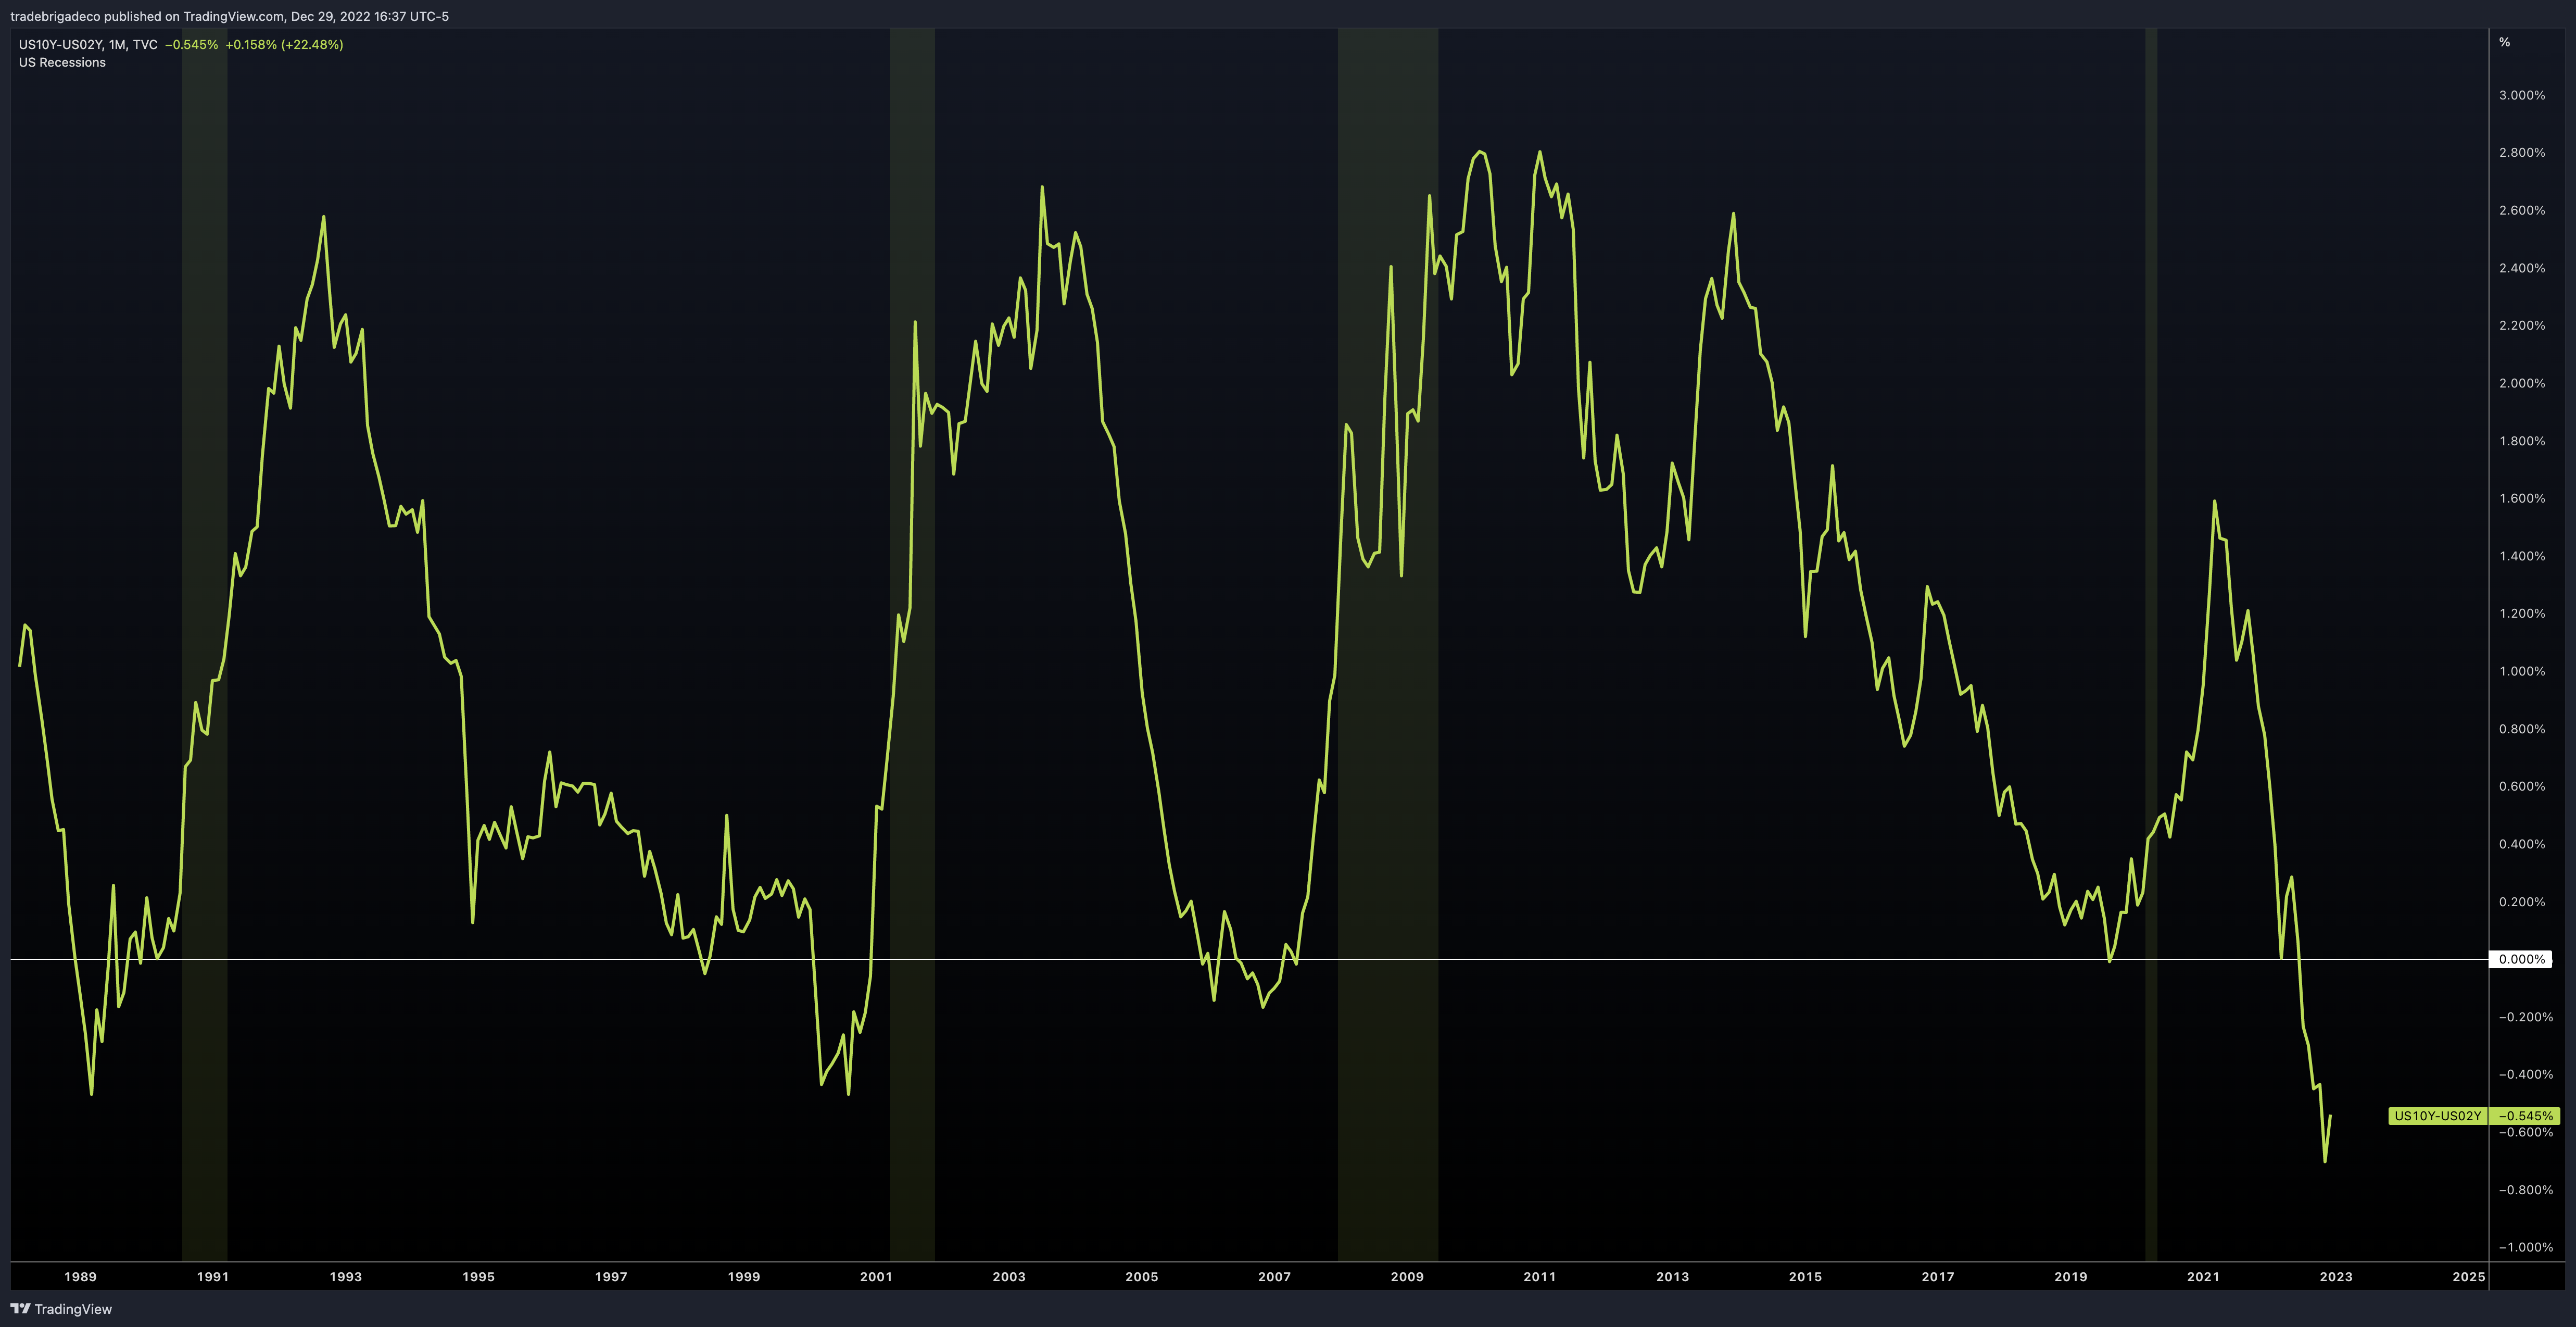 Figure 5: Inversion of US 10 year vs US 2 year recession signal
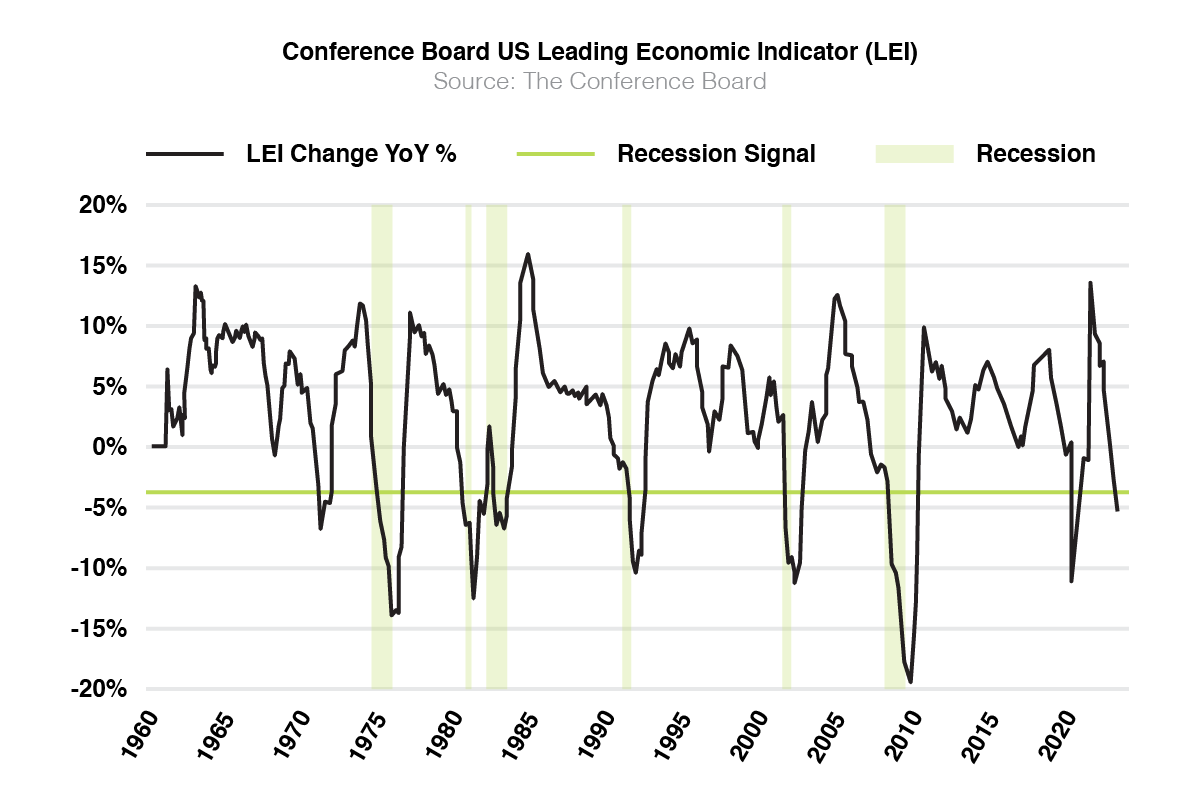 Figure 6: Conference Board Leading Economic Indicator recession signal
Forecasting the S&P 500’s value using the relationship of earnings estimates, compression multiples, and a PE ratio estimates we can see a broad range of outcomes for 2023 (Figure 7).
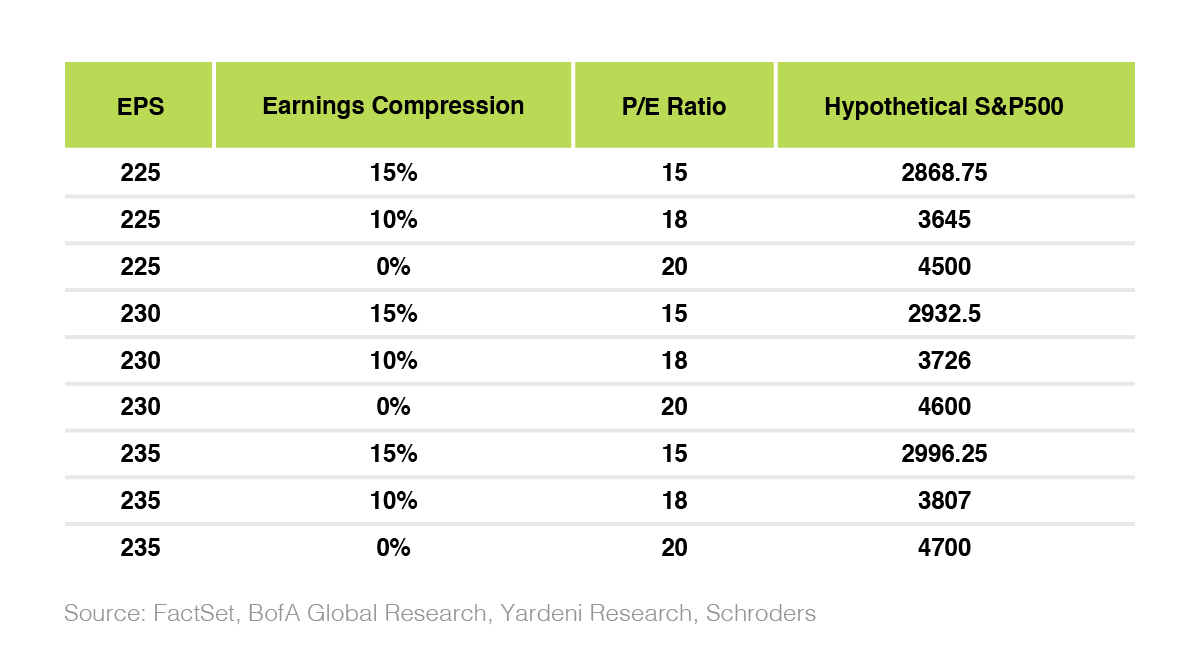 Figure 7: S&P 500 index forecasts based on EPS and PE
Noting that there may be material improvement to the earnings valuations when and if the Federal Reserve pauses rate hikes and potentially starts to cut rates, the upper bound of the forecasted range may be reserved for the second half of next year, or whenever the first rate cut happens. As of this writing, Fed Fund Futures are pricing in a first rate cut November 2023 (Figure 8).
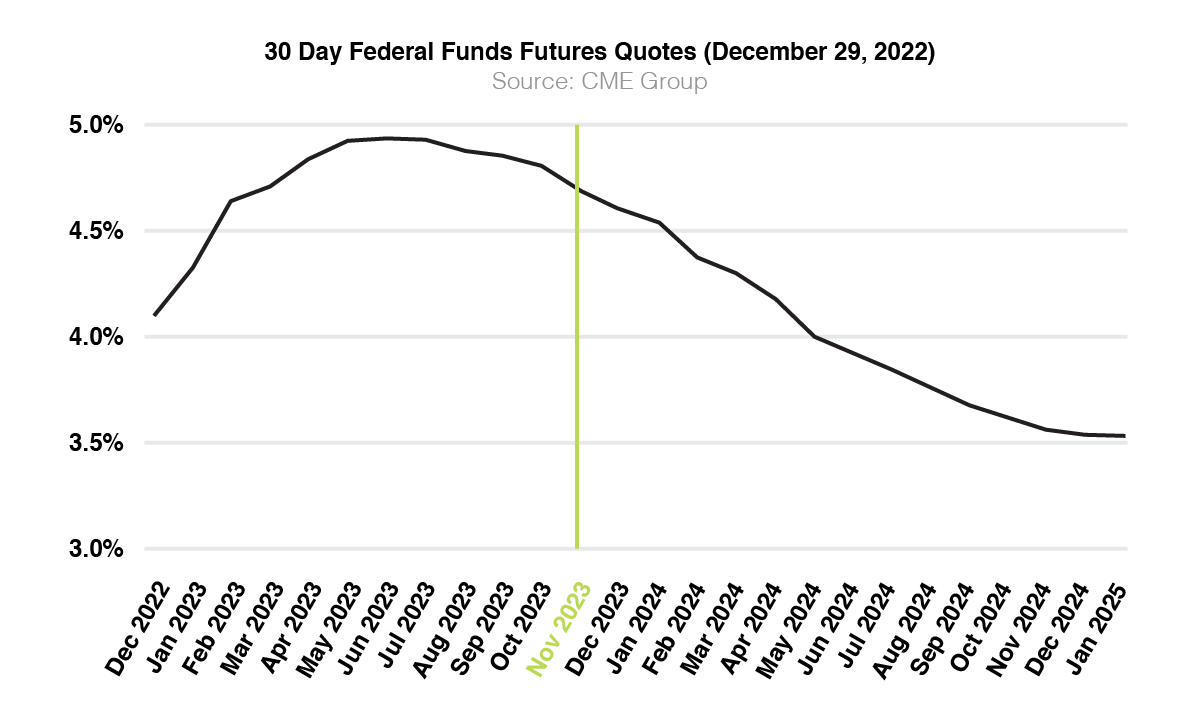 Figure 8: 30 Day Fed fund futures pricing up to January 2025
Considering the evidence presented thus far, there has been substantial progress in the direction of achieving fairly valued equity prices. However, just as compelling of a case can be made for further price declines in the first half, with some improvements possibly coming in the later half as and if the Fed pivots their stance (Figure 9).
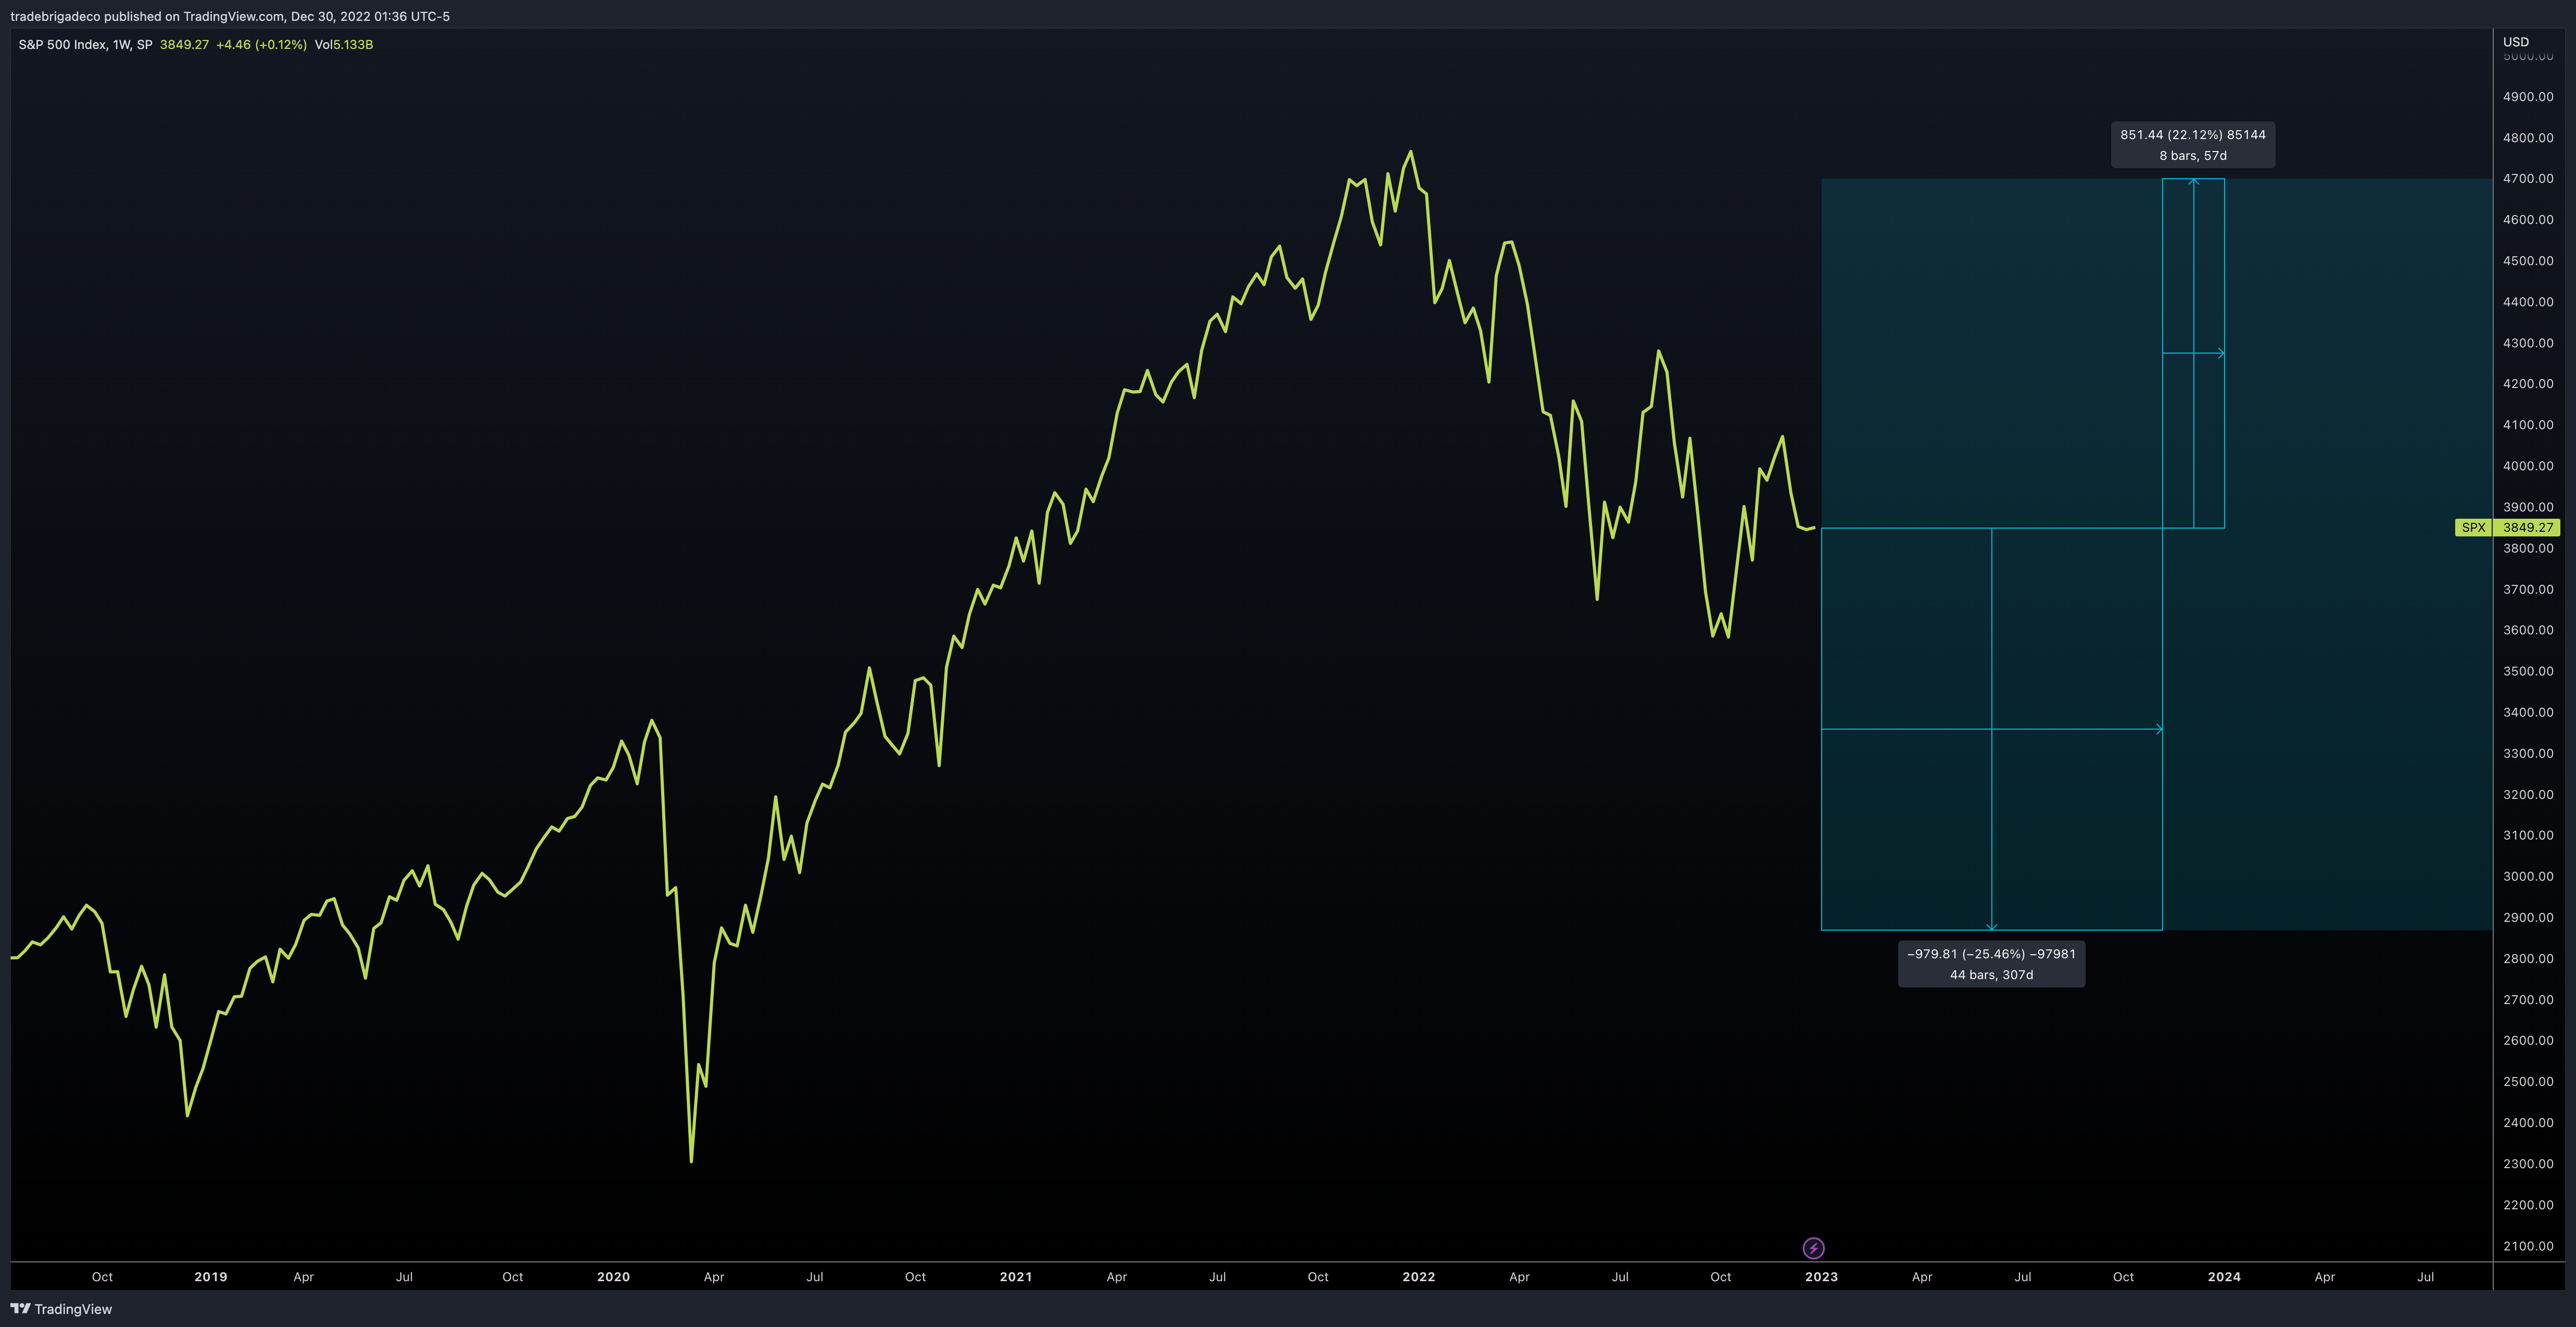 Figure 9: S&P 500 Index price range forecasts
Policy Lags – Services Inflation Still Untamed
In April and May of 2021, inflation became evident in the month over month consumer price index. April had expectations of 0.5% with an actual read of 0.6% and March had expectations of 0.2% with an actual read of 0.8%. Annualized, these represent more than three times the Federal Reserve’s target inflation goal of 2%. At the time, Fed Chair Powell reinforced that inflation was transitory and would return to target.
Fast forward to January 2022 and the year over year consumer price index reads 7%. A peak reading in July of 9.1%, and closing the year’s December read back at 7.1% may indicate the Federal Reserve’s restrictive monetary policy prevented inflation from continuing its rapid ascent (Figure 10). However, 7.1% is not 2%, and if we need to wait for policy lags to be reflected in the inflation numbers, we also need to wait for policy lags to be reflected in equity valuations.
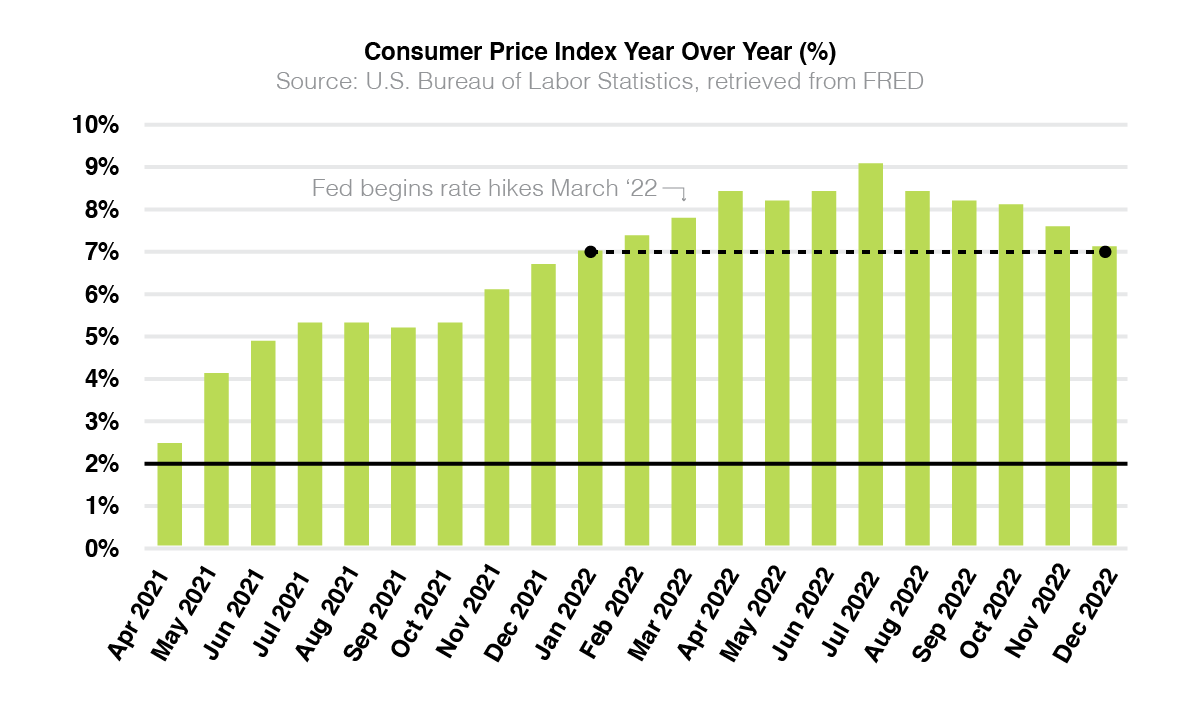 Figure 10: Consumer price index year over year readings as percent
Looking at similar periods in history, the 1970’s for persistent inflation and the 2000 Dot Com bubble for valuations, the market experiences further declines after the policy pivot from the Federal Reserve, indicative of the lag at which policy is reflected. Although the Great Financial Crisis of 2008 follows a similar pattern it is important to note the conditions were not similar to today, and instead were predicated on contemptible subprime lending standards. (Figure 11)
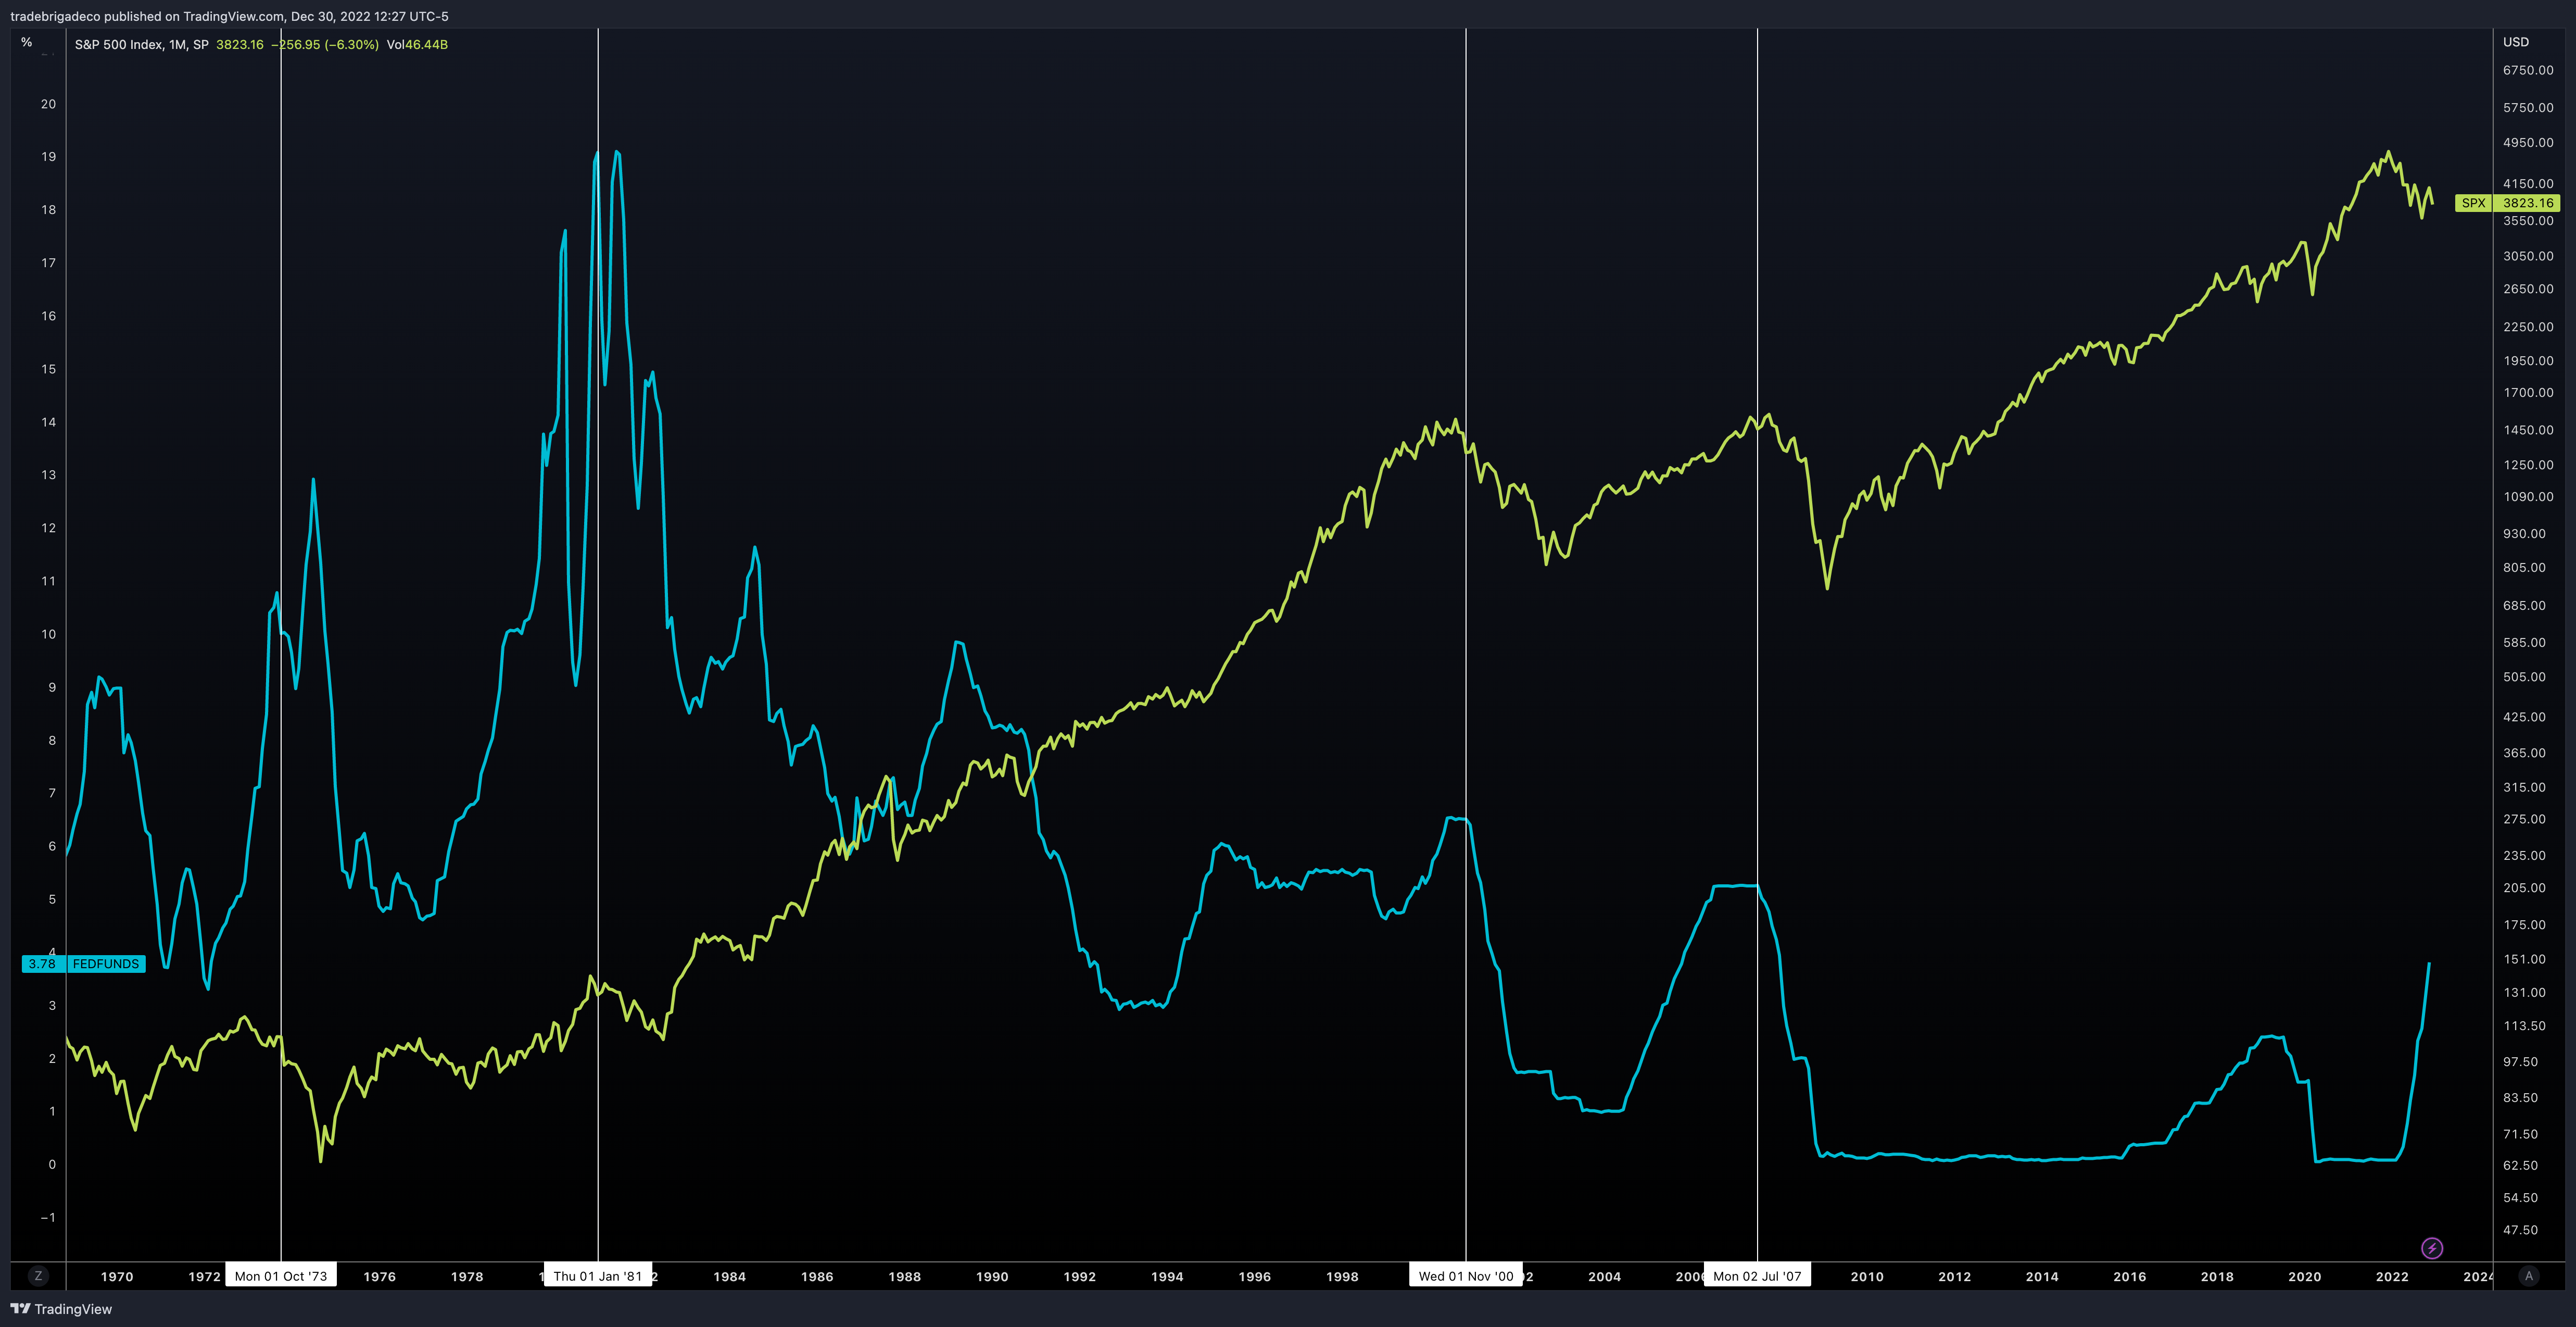 Figure 11: Fed pivots usually mean further downside for markets reflective of policy lag
As retail sales are slowing down, and consumer savings are eroding (Figure 12), the possibility for a negative feedback loop on valuations increases. The Fed dampening demand through the rate hike campaign, not only compresses multiples, but also stifles earnings growth as less demand leads to fewer sales for companies to report.
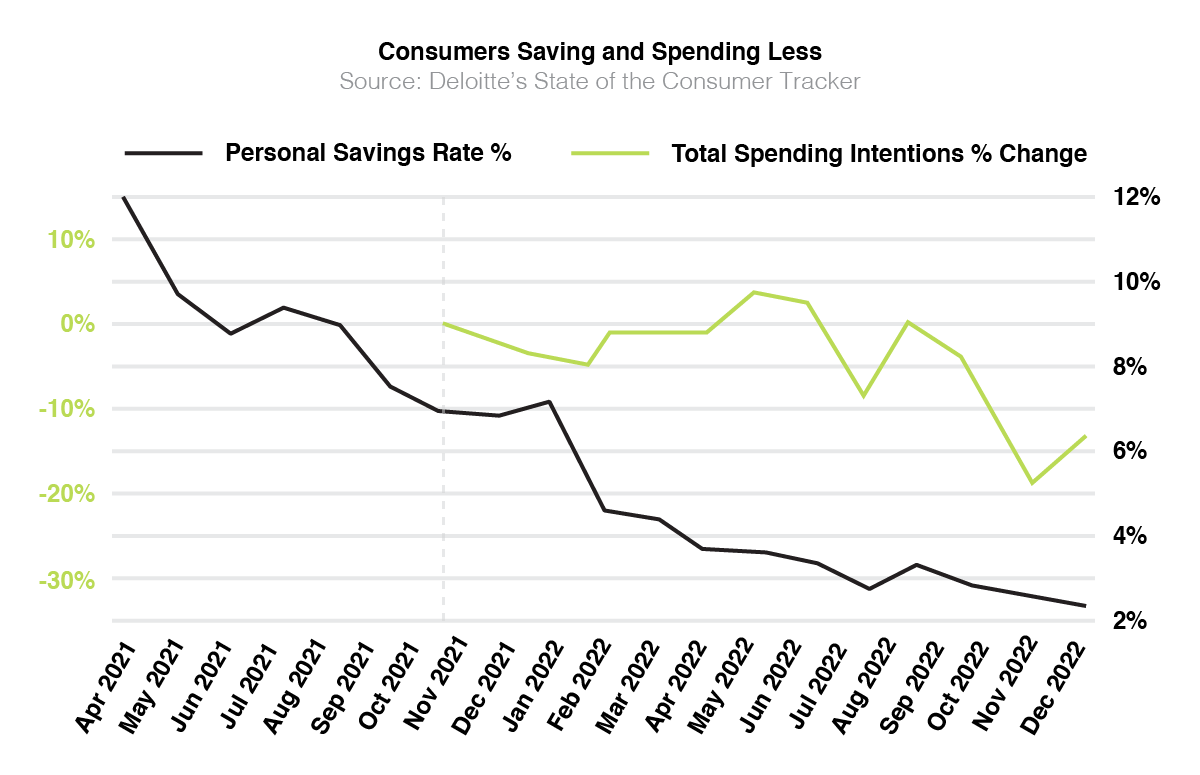 Figure 12: Consumers are saving less and have less intention on spending
Admittedly some progress has been made in derailing the trend of runaway inflation. Now the question becomes whether the Fed has hiked enough to combat sticky inflation observed in the services industry to bring readings back to the 2% target (Figure 13).
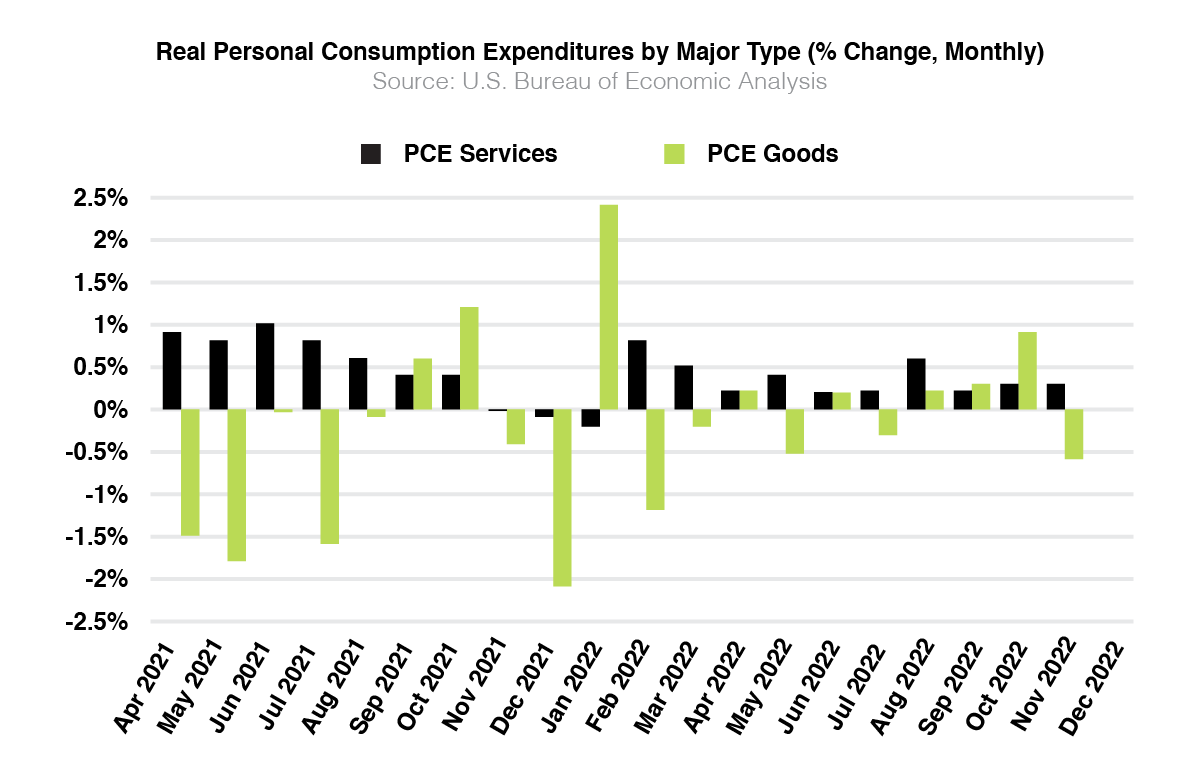 Figure 13: PCE services inflation continues to be sticky despite improvements in PCE goods inflation
The Taylor Rule, would indicate the answer to said question is no, the Fed has not hiked rates high enough to persuade inflation down to the 2% target (Figure 14). Limitations of the Taylor Rule include dramatically reducing the nuances between interest rates, inflation, and employment. Aware of this, the Taylor Rule may be most helpful to determine direction not absolute value. Rates continuing higher, as discussed in the equites section, further the potential damage that can be done to valuations, favoring the lower end of the forecast S&P 500 range.
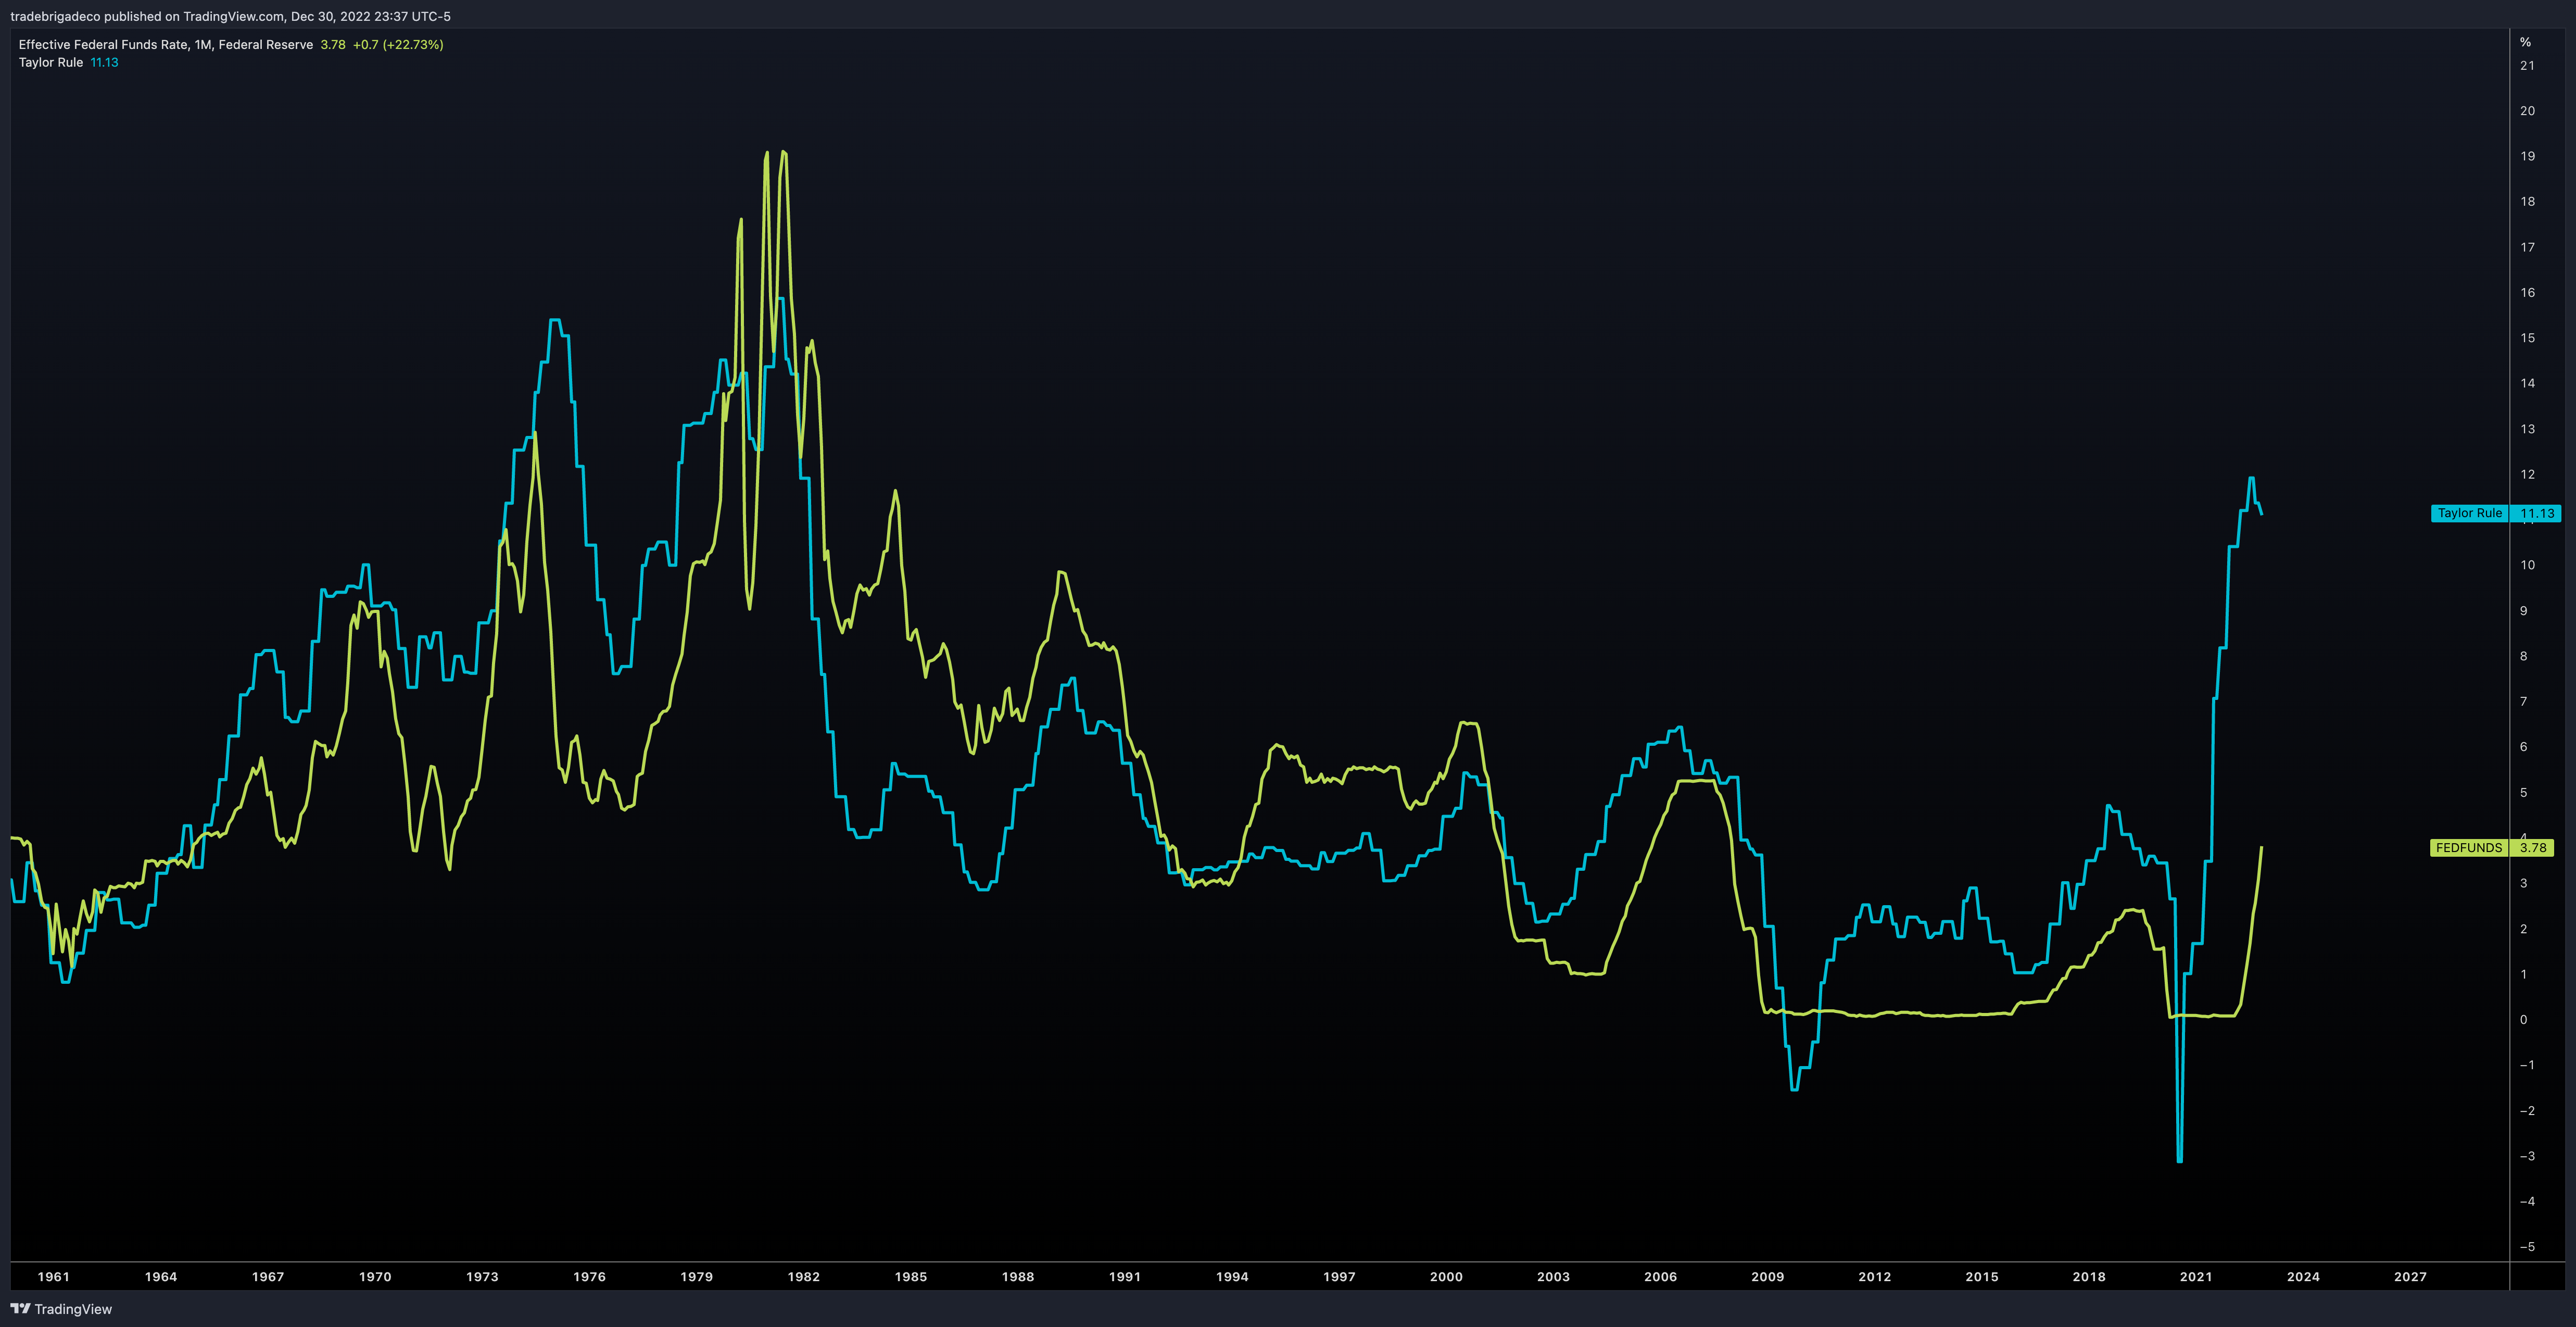 Figure 14: Fed funds rate (green) vs Taylor Rule estimate (blue)
Antagonists of Persistent Inflation – A War on Two Fronts
Labor Force Participation
Two factors influencing the lower levels of labor force participation are an aging population, and early retirees who never returned to work in a post pandemic world (Figure 15).
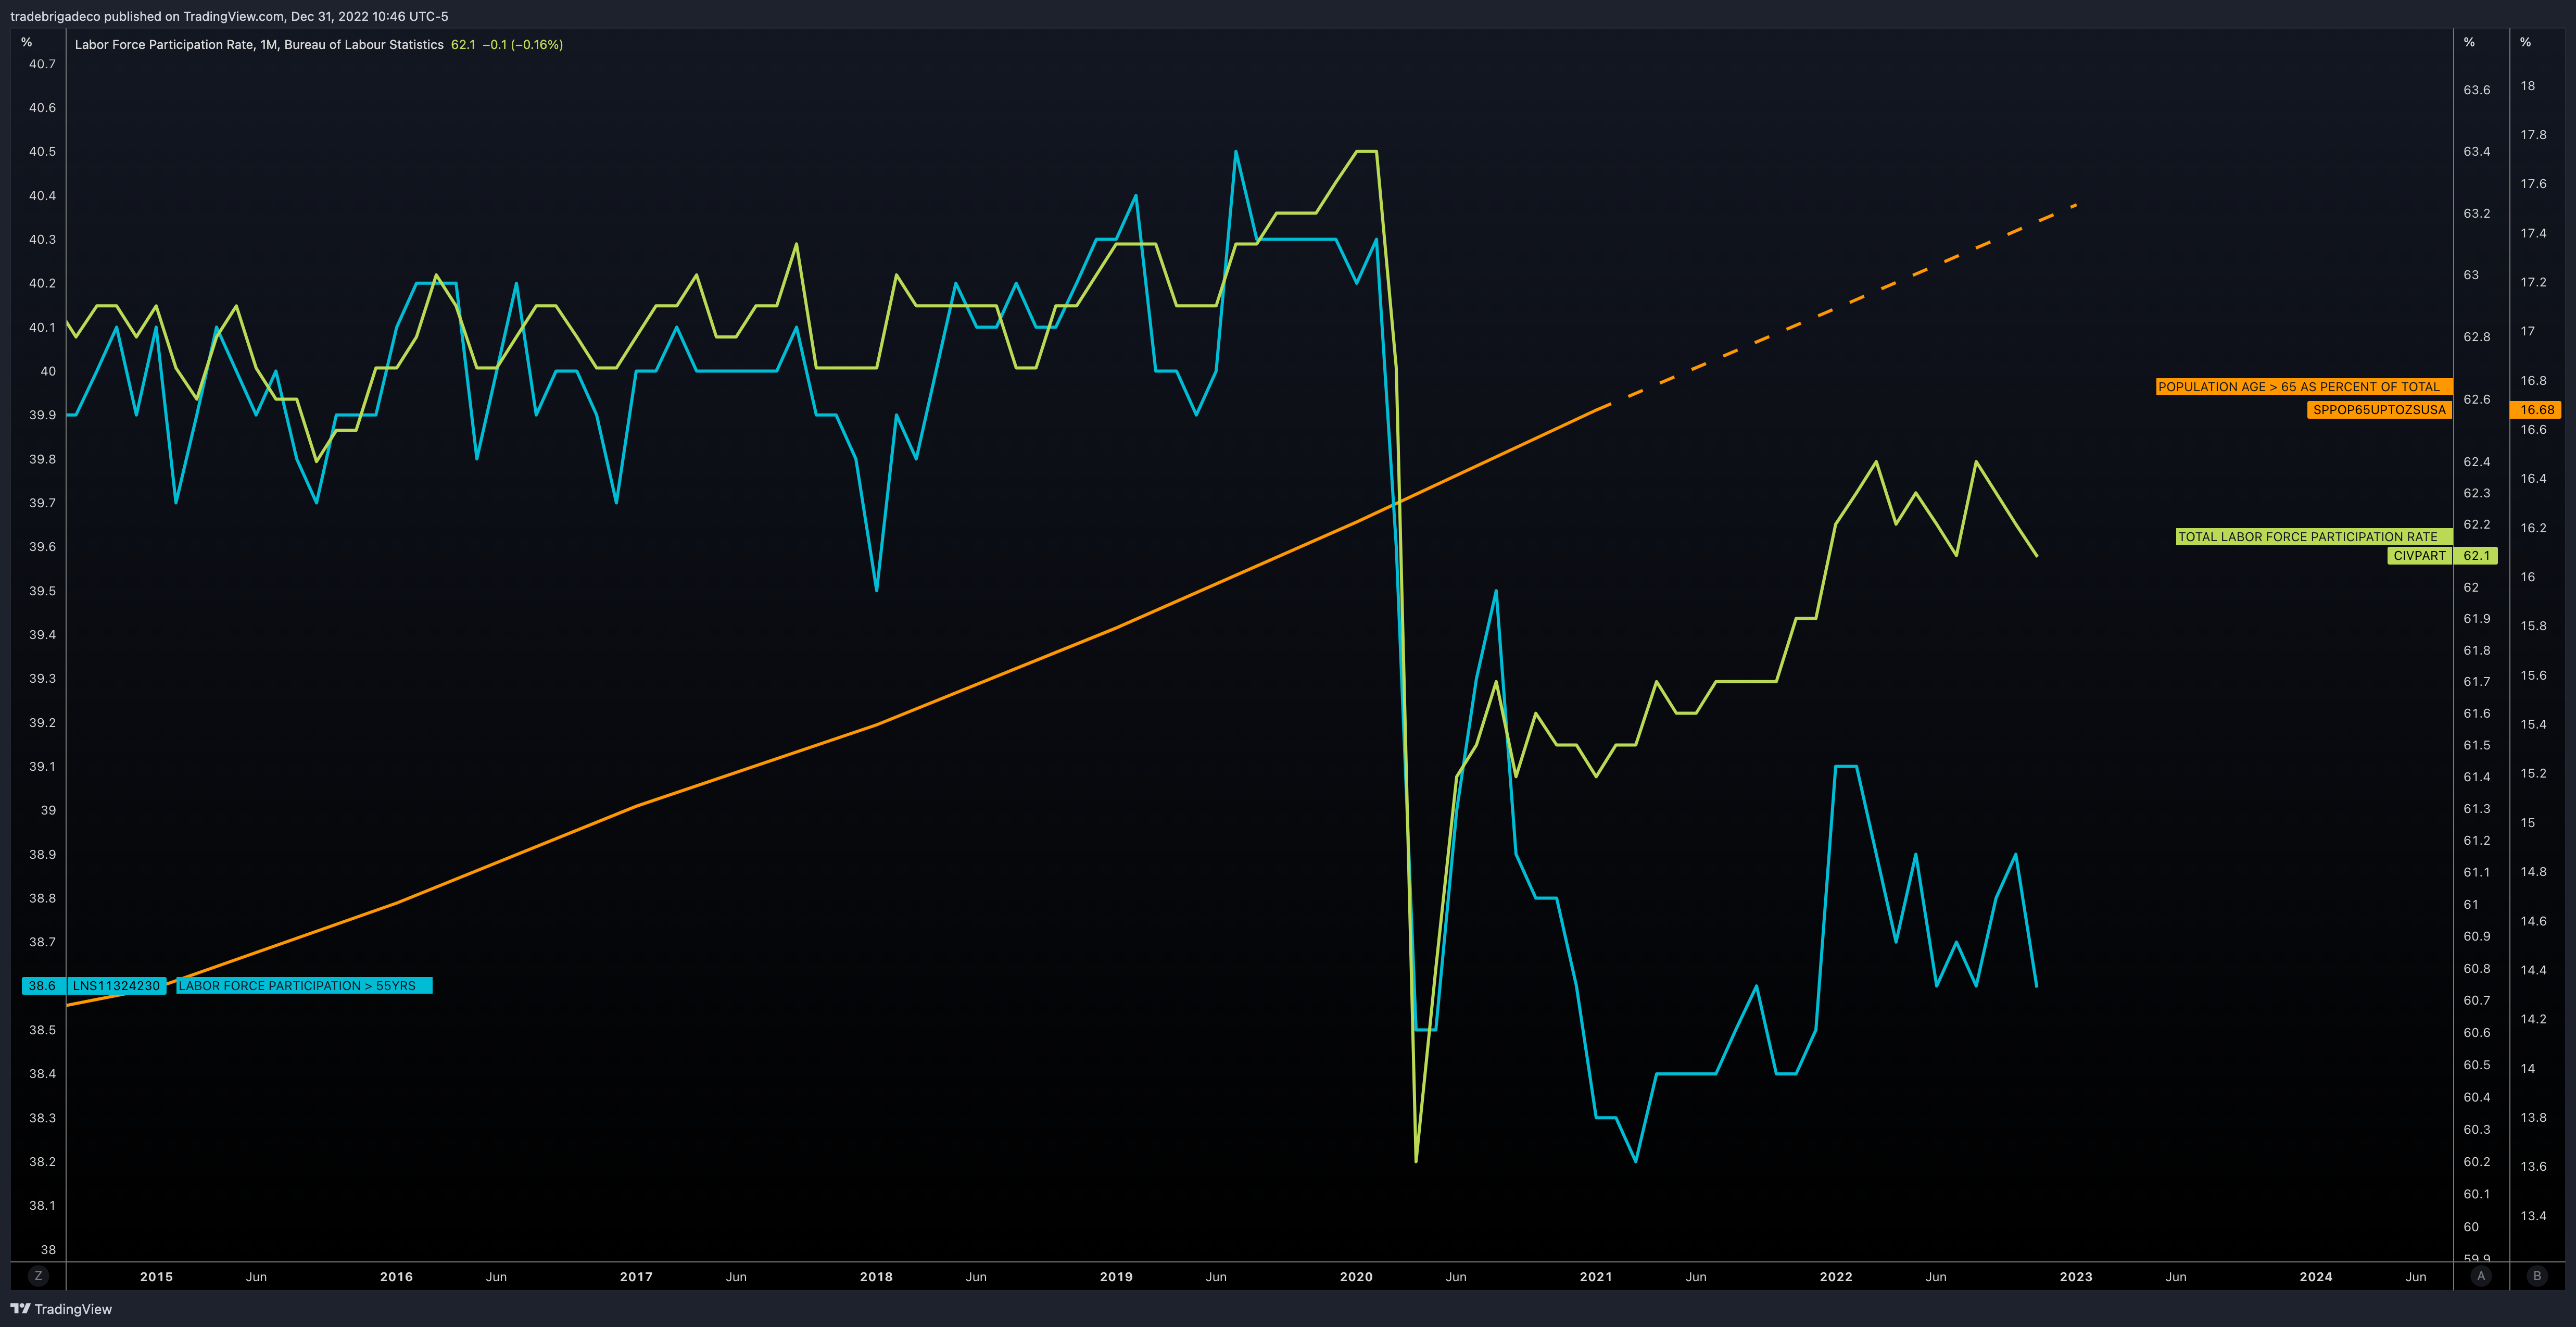 Figure 15: Labor force participation rate (green) vs labor force participation rate 55+ (blue) vs population age 65+ (orange)
The shortage of workers has kept labor markets tight even as the Fed initiated the transition to restrictive monetary policy in 2022. Persistent inflation could come from a wage-price spiral, a possible threat as this imbalance of workers implies demand for higher wages in a competitive environment. Average hourly earnings are up 8% from the pre-pandemic trend and although job openings have come down, they are still historically high with roughly two jobs for every one unemployed person (Figure 16).
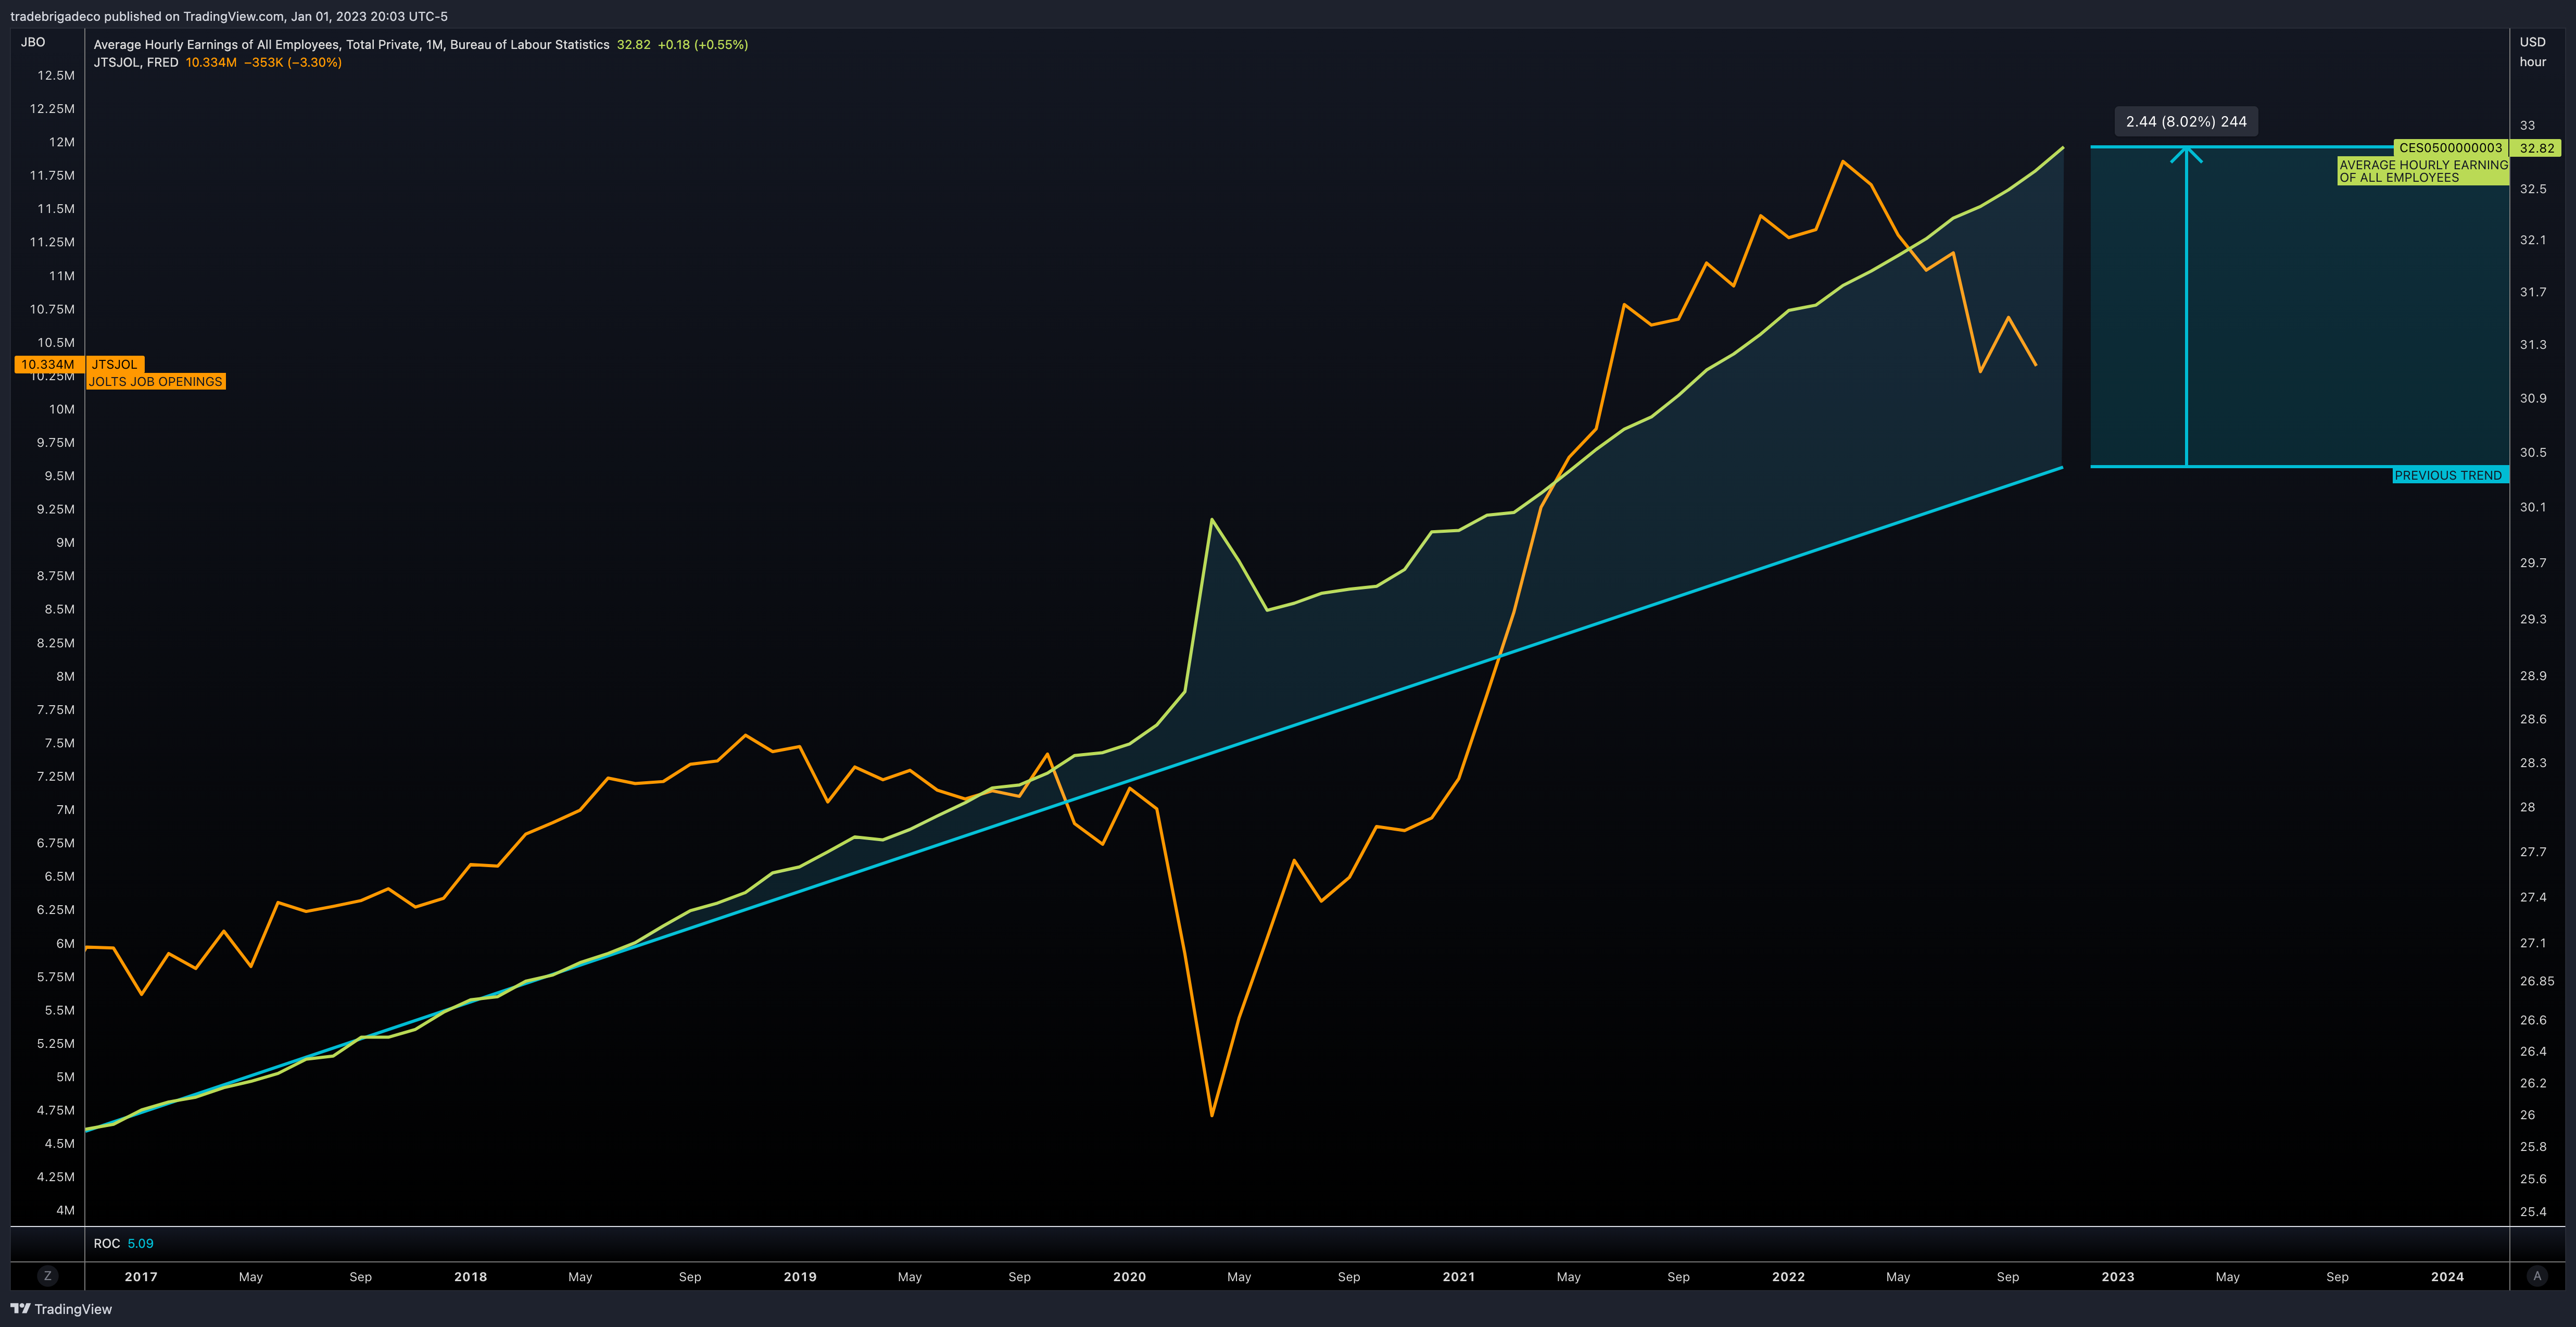 Figure 16: Average hourly earnings (green) vs average hourly earnings previous trend (blue) vs JOLTS job openings (orange)
Aging populations do tend to reduce their consumption across food, housing, and transportation, but increase consumption of healthcare related services. If demand for goods and services remains constant in this trade off, increased costs of labor and input commodities will be passed on to the consumer (Figure 17), consistent with an environment where inflation runs well above the Fed’s 2% goal. This produces a negative feedback loop for hiking rates until conditions improve or revising the long term inflation goal which Jerome Powell has explicitly indicated is not a consideration.
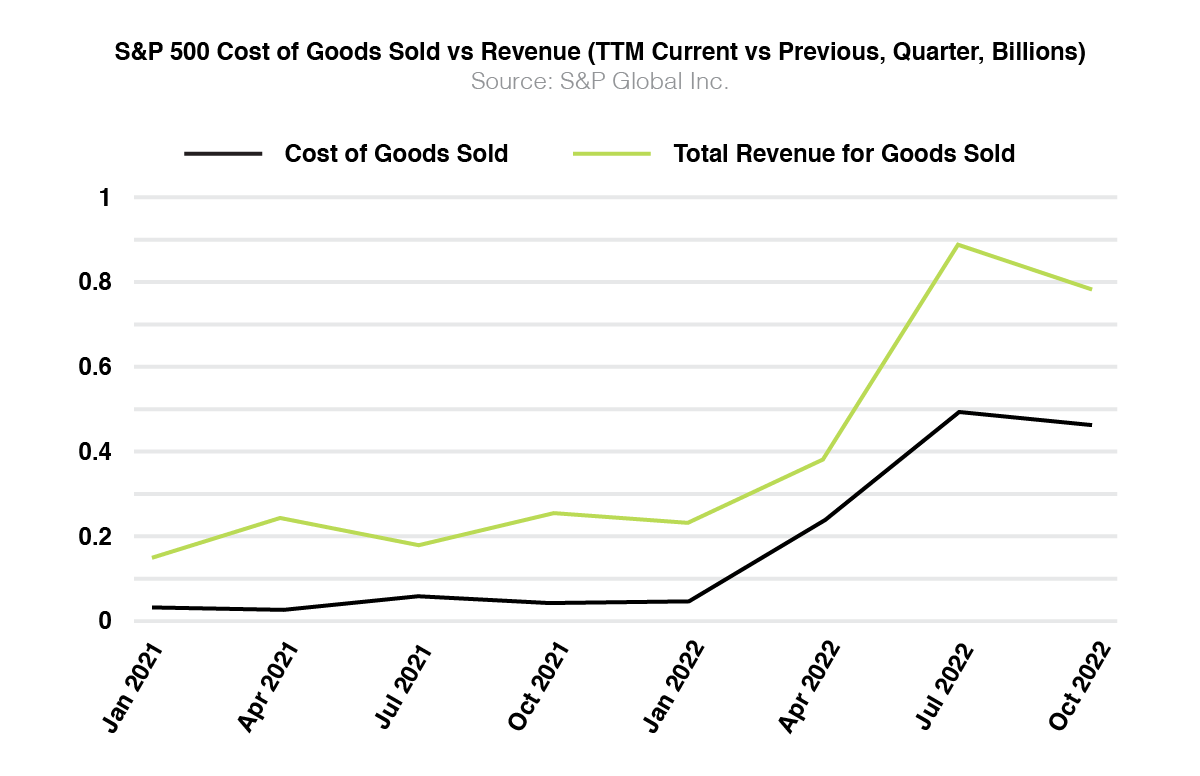 Figure 17: Cost of goods sold vs revenue for goods sold indicates inflationary costs are passed to consumers
Deglobalization
Geopolitical tensions have risen considerably through 2022 leading to the reduction of free and open trade on a global scale. This has become another driving force for inflation, particularly evident in the energy sector. On the world’s stage, Europe’s journey to become energy independent from Russian gas has increased costs for consumers (Figure 18). Although the United States is insulated to some degree from the impact of this transition, manufactured goods, the top import from the European Union, will experience some trickle down costs increases.
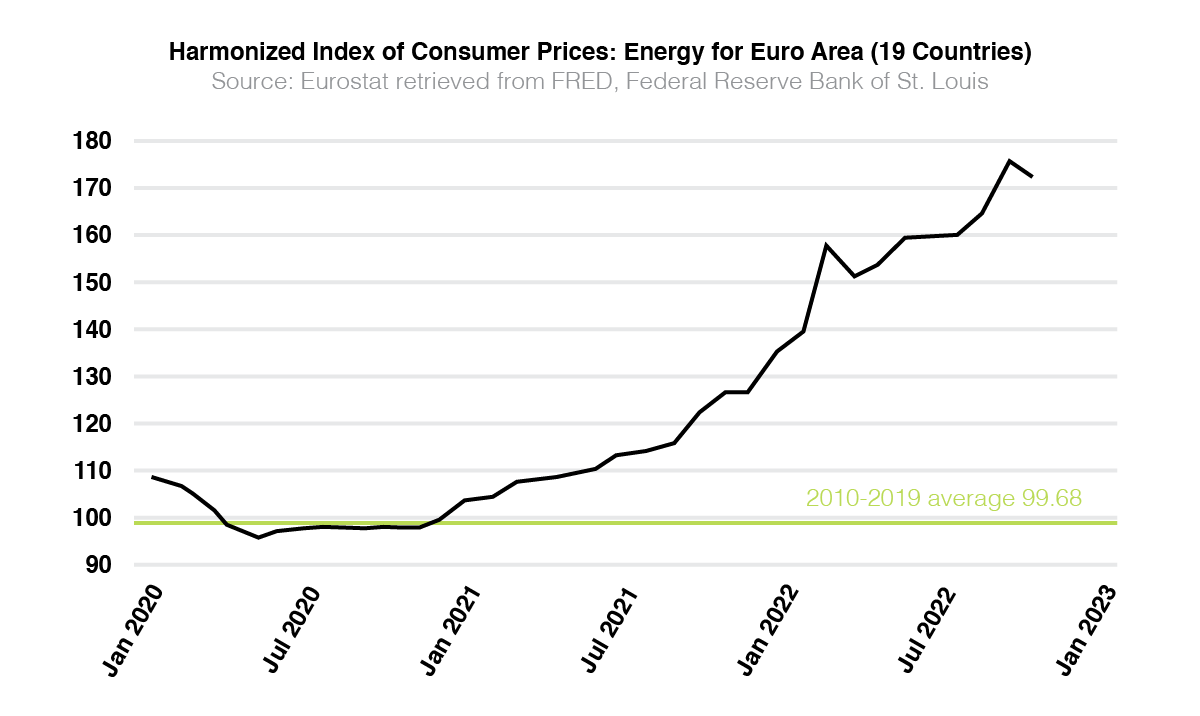 Figure 18: Energy price index for Euro area (19 countries) vs prior 10 year average.
Sanctions on China that impact the trade of semiconductors and advanced computing technologies are disrupting global supply chains (Figure 19). For the technology sector, the heaviest weighted sector by market capitalization, and thus having the most impact on US markets, this inflationary relationship will likely yield negative impacts across the entire S&P 500. With tech already the primary adversary of a higher interest rate environment, this should be a continued headwind for markets moving into 2023.
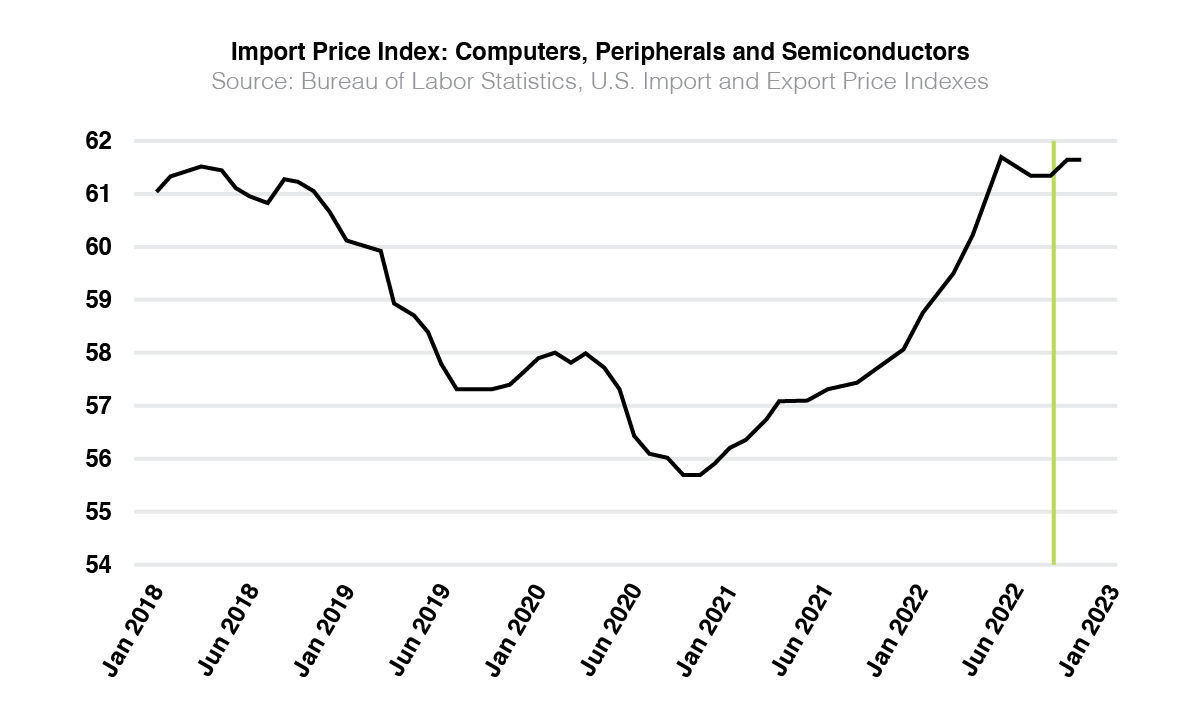 Figure 19: Sanctions imposed on imports of Chinese technology products prevents a budding downtrend.
The Opportunity
Although the macro environment has seemingly shown very little improvement from the issues presented for 2022, it is likely that a larger opportunity for upside could be around the corner, when and if any of the aforementioned issues start to show any signs of resolve. Recognizing the forward looking nature of the market, we will likely see a bottom in the S&P 500 prior to technically exiting any officially recognized recession (Figure 20).
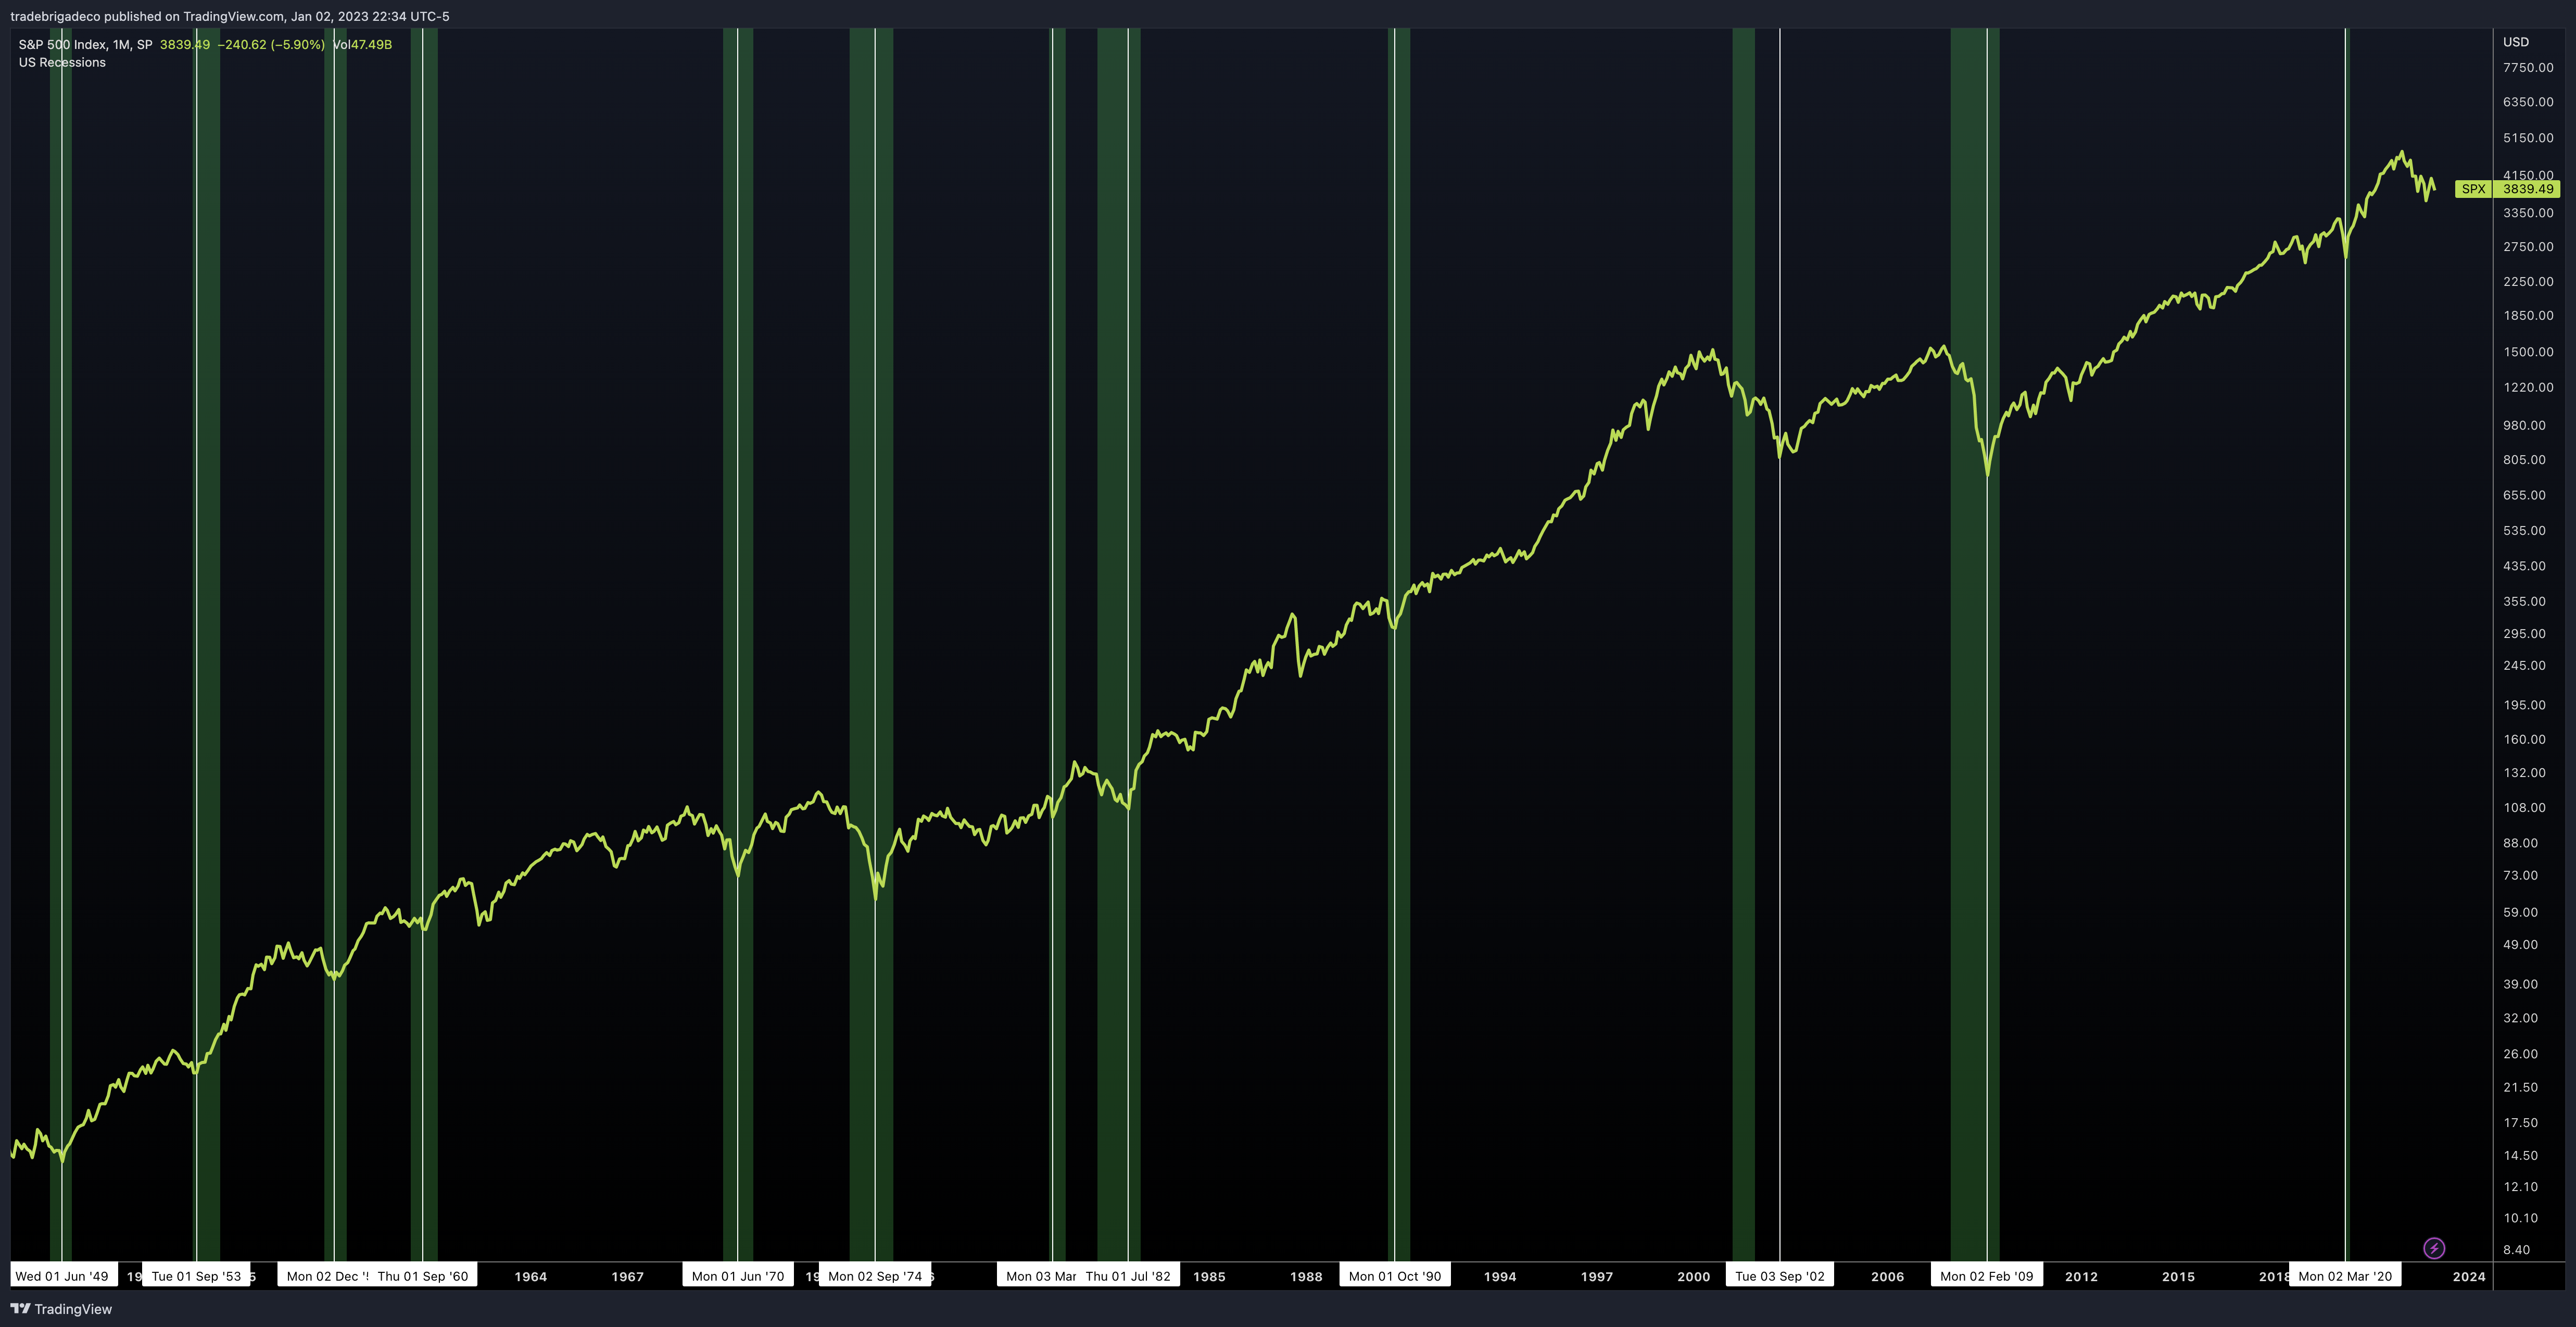 Figure 20: S&P 500 Index historically bottoms before the recession is considered over
After a rate hiking cycle ends there are typically bearish waterfall events in the short term as described in the “Policy Lags” section. However looking out six to twelve months from the end of the cycle things typically tend to get much better (Figure 21).
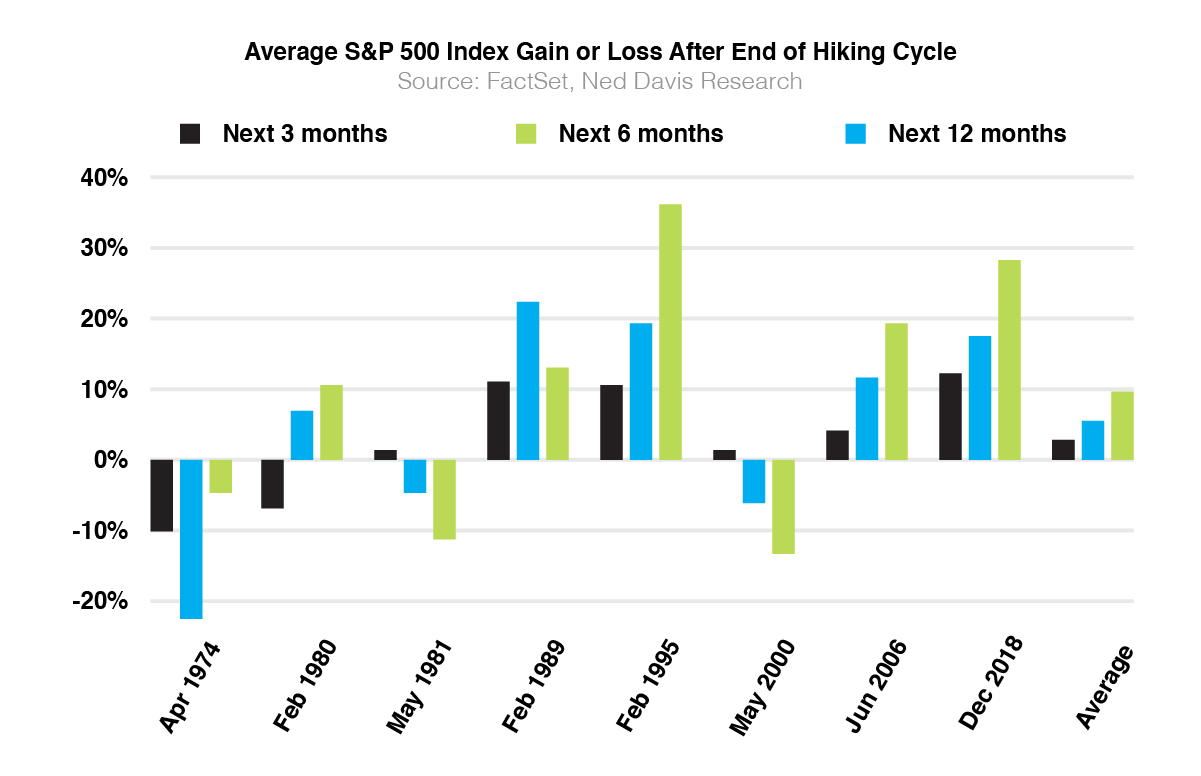 Figure 21: Longer term effects of Fed policy pivot tend to favor positive returns
The average return of the S&P 500 index has historically higher odds of positive return after a down year (Figure 22).
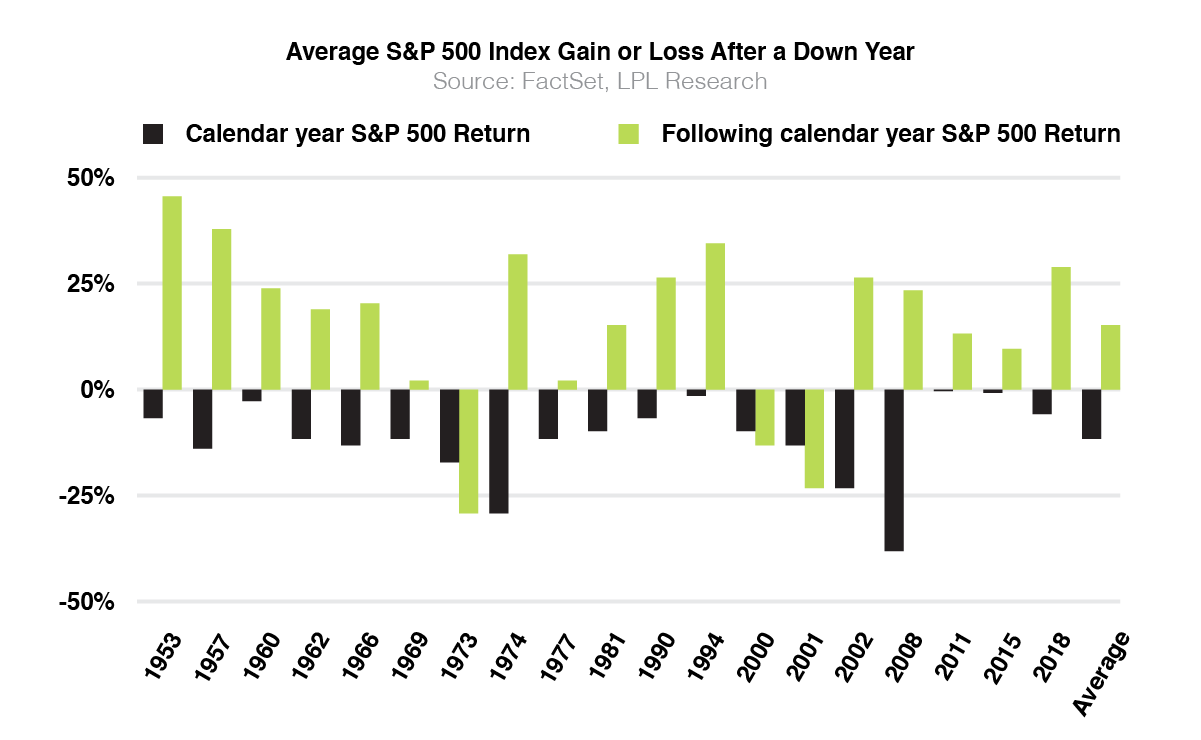 Figure 22: Average return of S&P 500 Index after down year
Dating back to 1950, the S&P 500 has only experienced back to back down years in two instances (Figure 23).
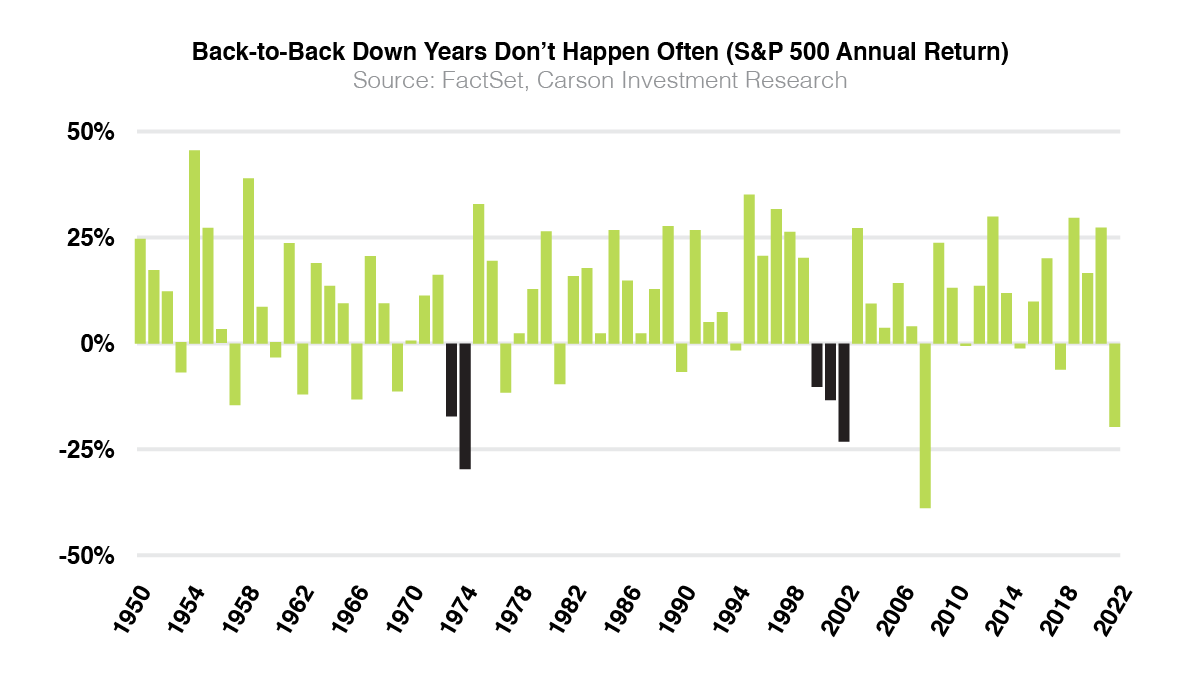 Figure 23: S&P 500 Index back to back down years
On average, the S&P 500 experiences a 14% intra-year drawdown, but 32 of 42 years have closed positive (Figure 24). It would be normal to experience the deep draw down of our lower bound and then close the year on a positive note.
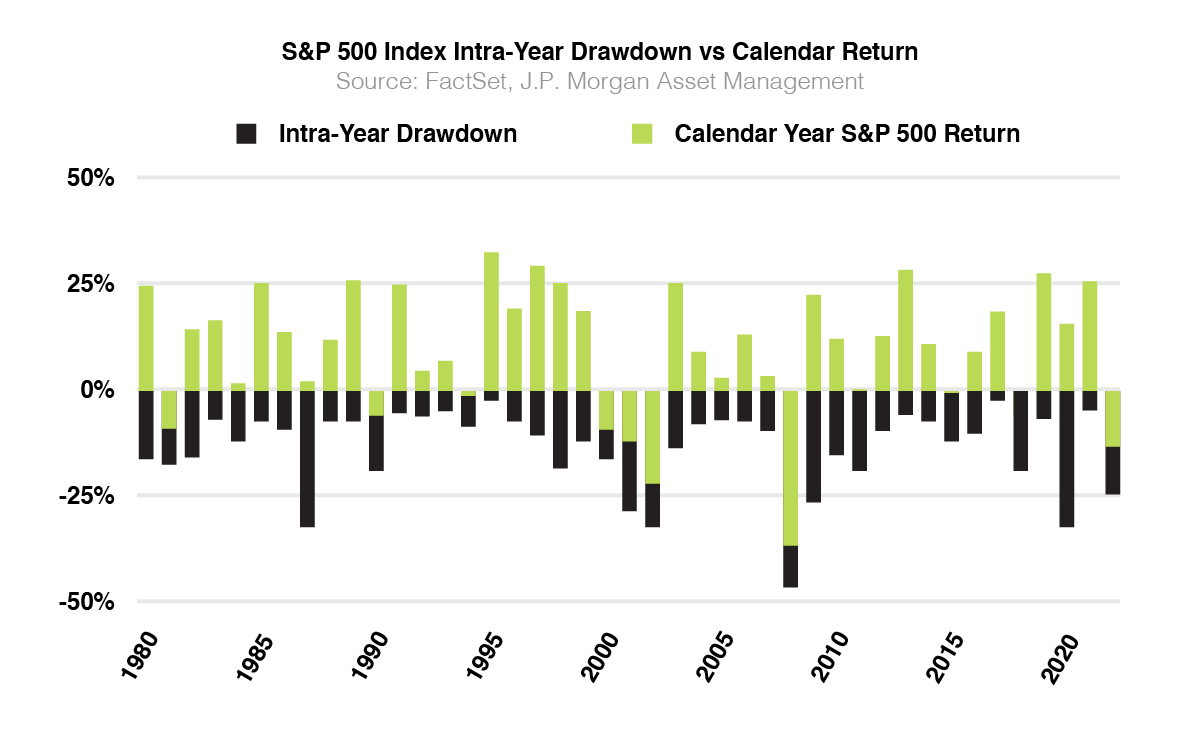 Figure 24: S&P 500 Index intra-year drawdown vs calendar return
It is pertinent that the first half of 2023 is approached with maximum flexibility and the willingness to adjust based on the incoming and ever changing data. If there are improvements to the market early, be ready, and if the improvements don’t come at all, don’t be disappointed. It is our view that remaining underweight in risk on US equities, neutral on risk off equities and overweight cash is the proper allocation to begin the new year. This leaves us exposed to some of the potential gains in insulated sectors such as healthcare (aging population) and energy (inflation and deglobalization).
Those looking to capture fixed income from bonds may favor the shorter end of the spectrum. As the ten and two year remain inverted there is no reason to go further out in the curve to capture just as significant of a return. Anyone participating in this strategy should be mindful of the opportunity cost imposed by not having liquid cash ready for when and if we get improvement in macro conditions.
This will be a year to prioritize the management of risk exposure to select sectors instead of chasing outsized returns.
S&P 500 Technical Analysis
Figure 25 illustrates the most noteworthy areas of support for this upcoming year:
- Weekly 200 SMA
- Value area low (Covid low – present)
- 50% fibonacci retracement and 2022 low (Covid low – present)
- Pre covid highs
It is our view that breaking these areas of support, combined with continued monetary tightening could be a catalyst for reaching the lower bound of the forecast range.This speaks to improved odds, not guarantees.
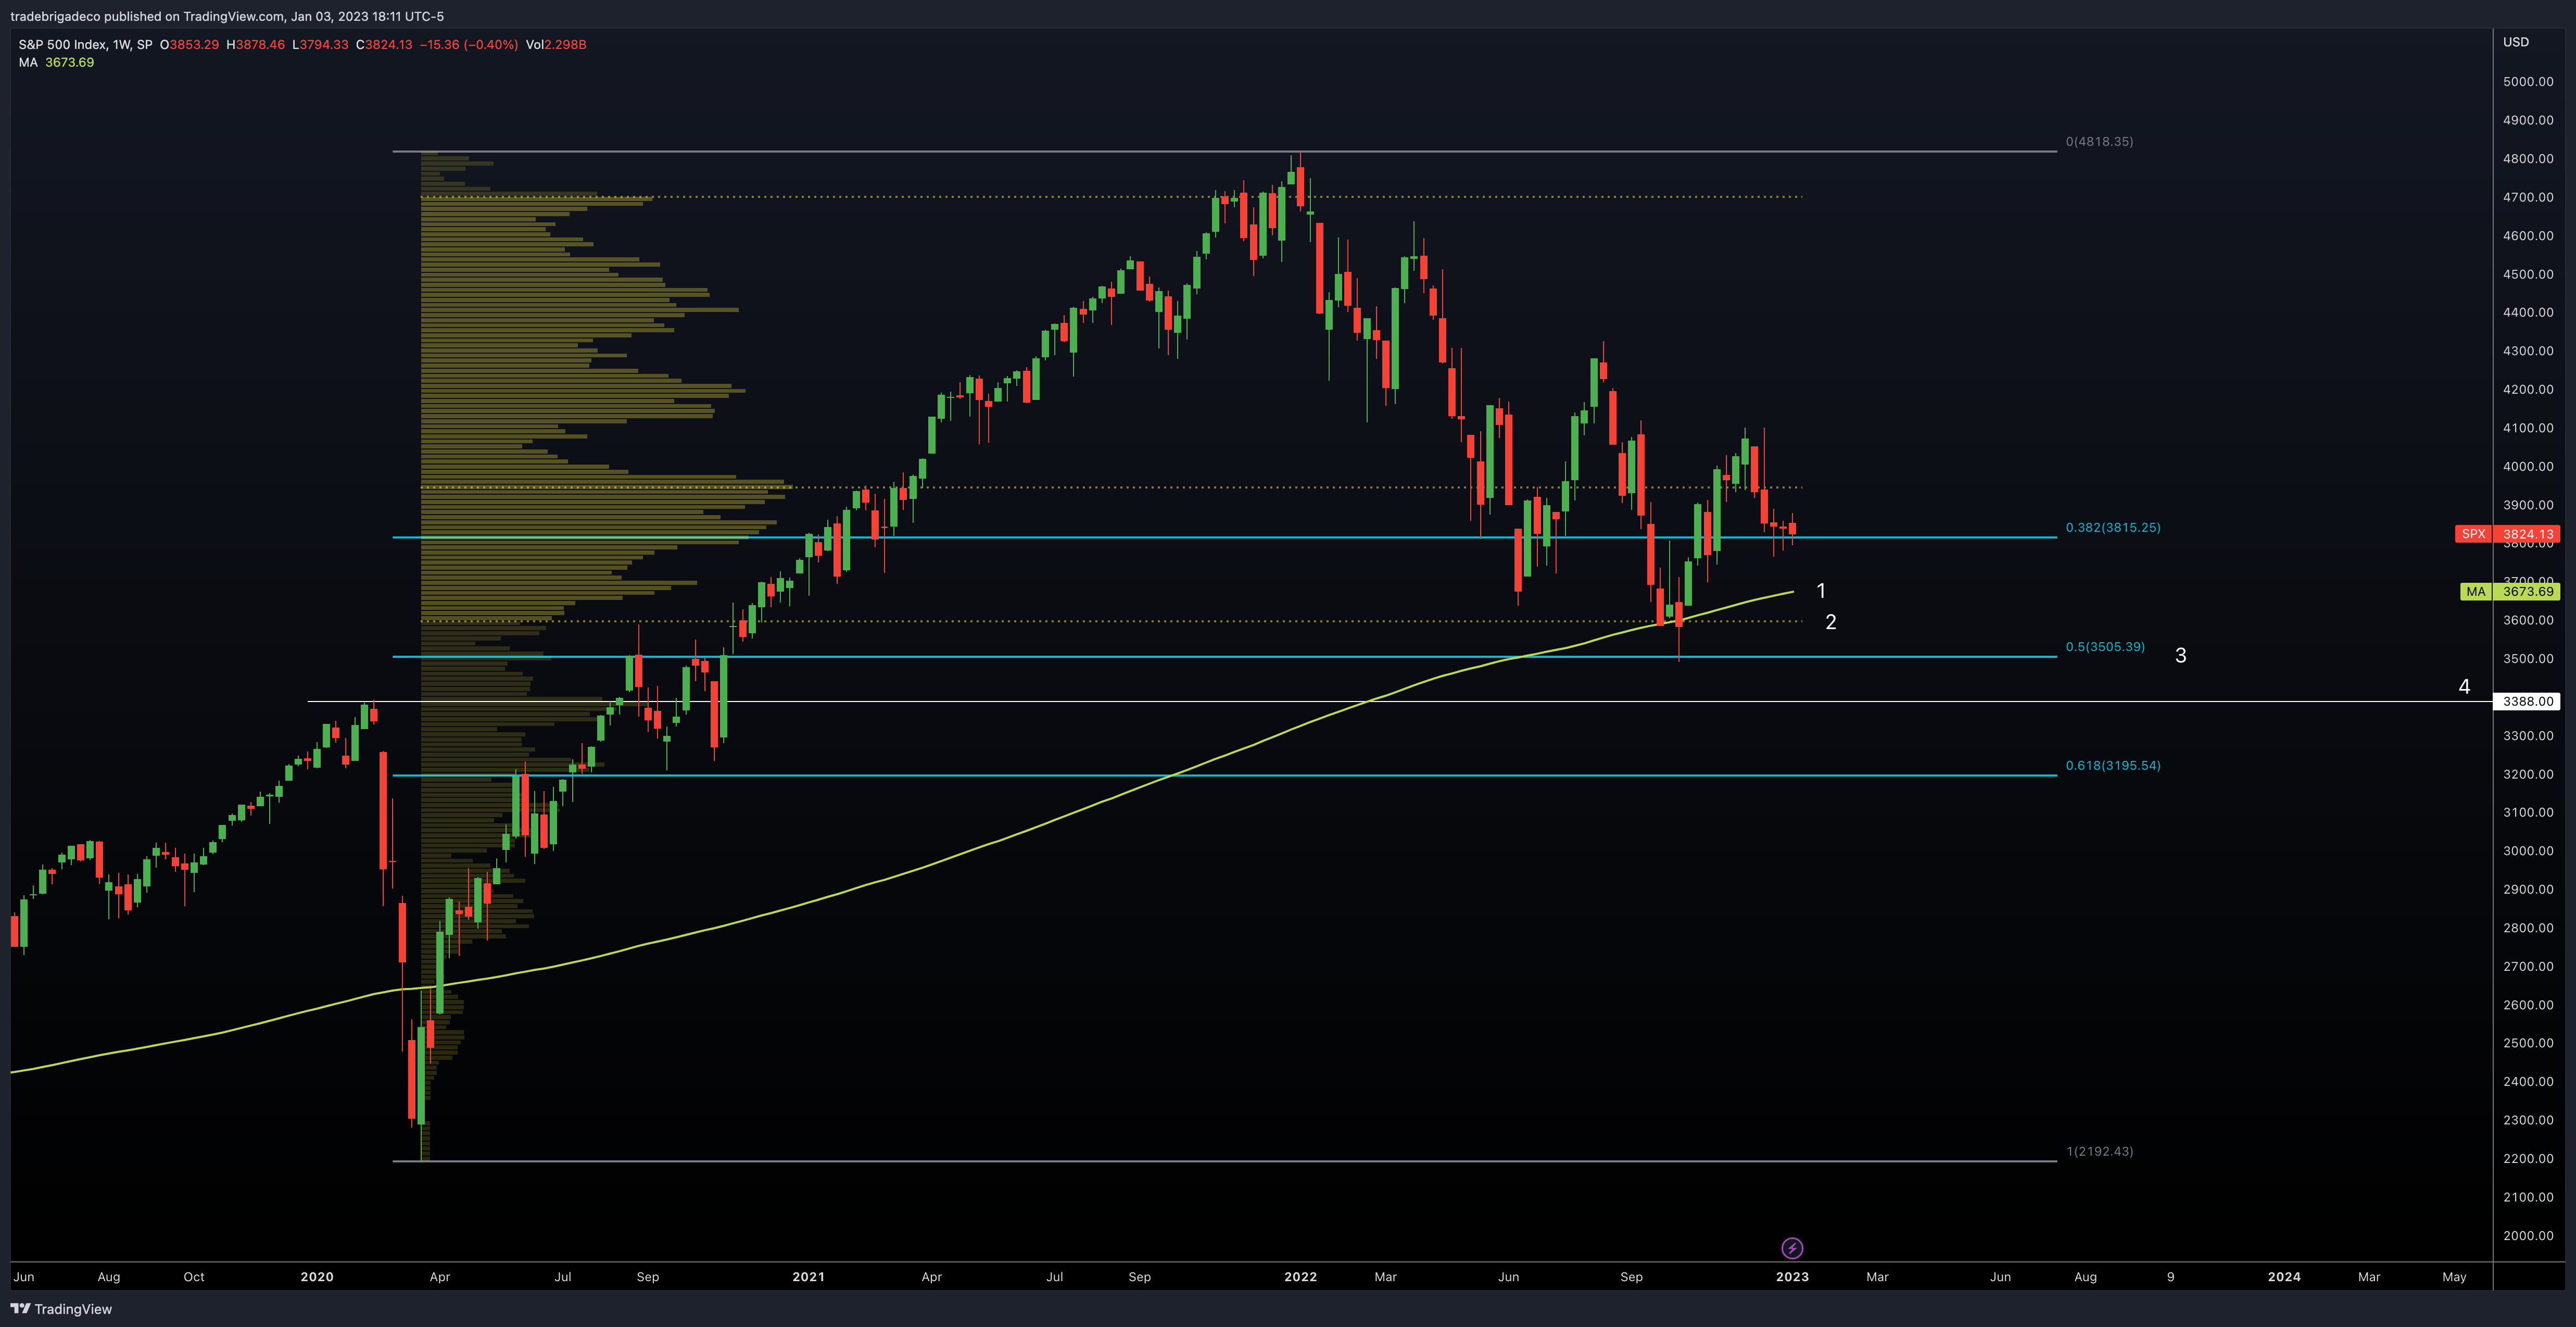 Figure 25
Figure 26 illustrates the most noteworthy areas of resistance for this upcoming year:
- Weekly 50 SMA
- Anchored VWAP from 2022 high. (All time high)
- Weekly resistance trendline
- High volume node
It is our view that breaking these areas of resistance, combined with a possible loosening of monetary policy could be a catalyst for reaching the upper bound of the forecast range. This speaks to improved odds, not guarantees.
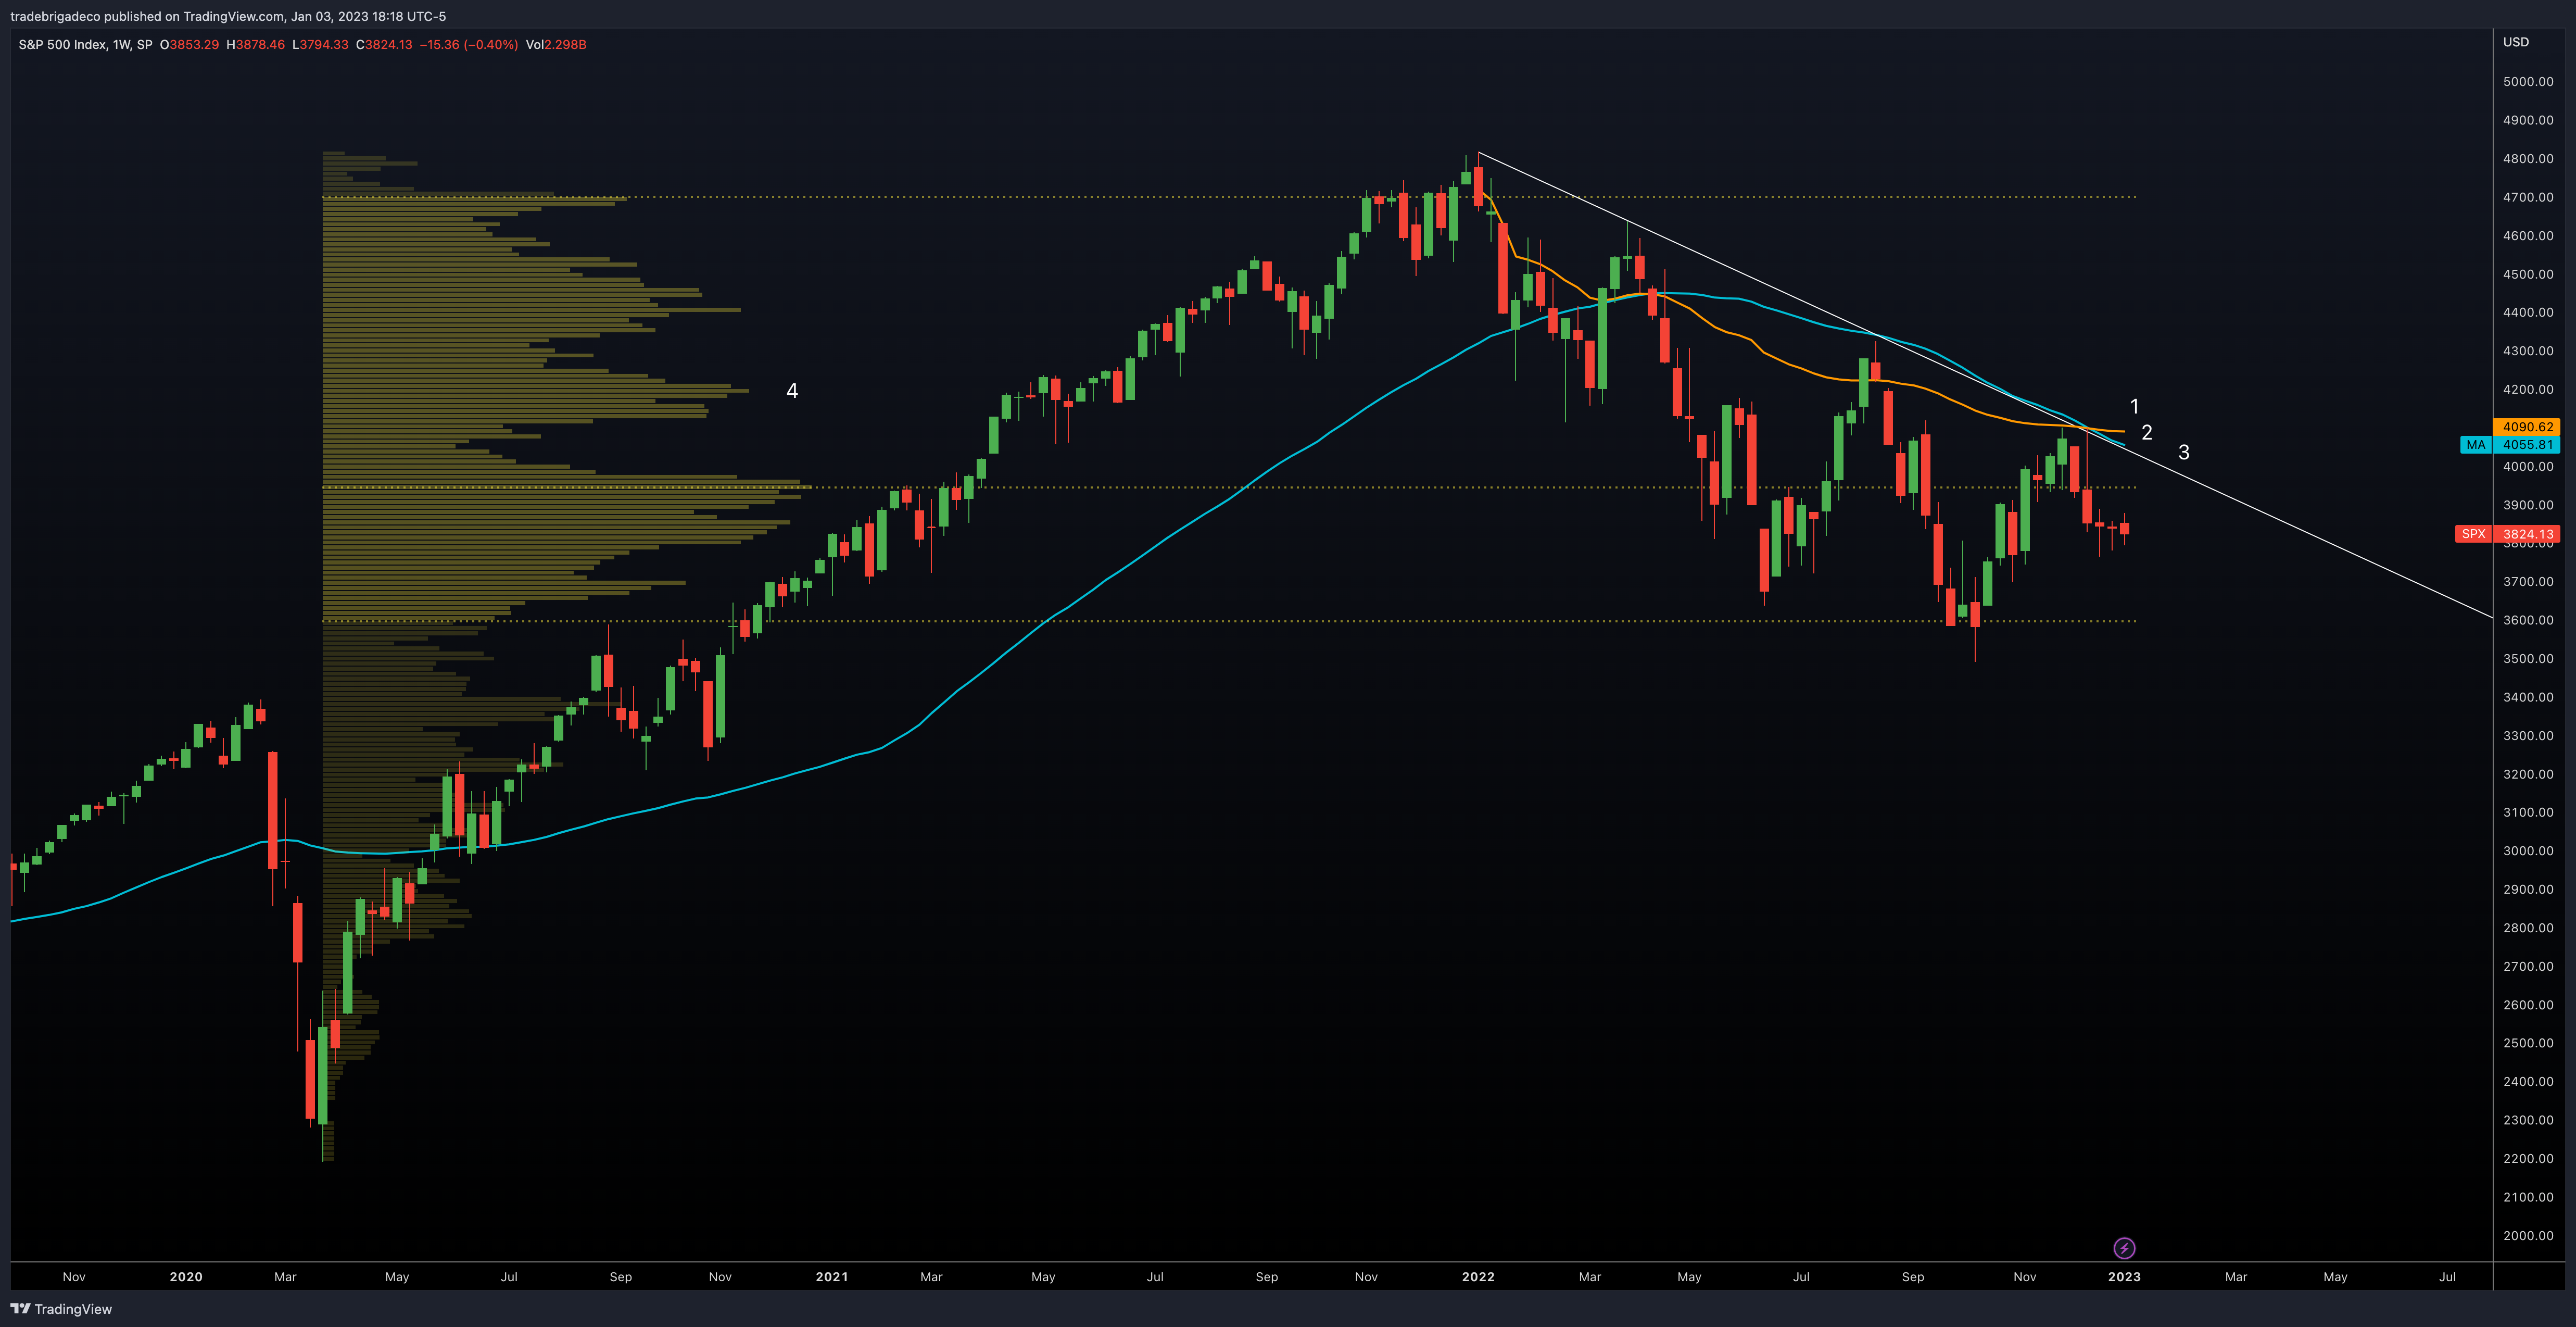 Figure 26
Looking at momentum studies, we can also see a positive bullish divergence playing out between price and indicator value (Figure 27). The price action may not be as bearish as it seems and is different from other major bear markets where momentum indicators remained bearish into lows. This speaks to improved odds, not guarantees.
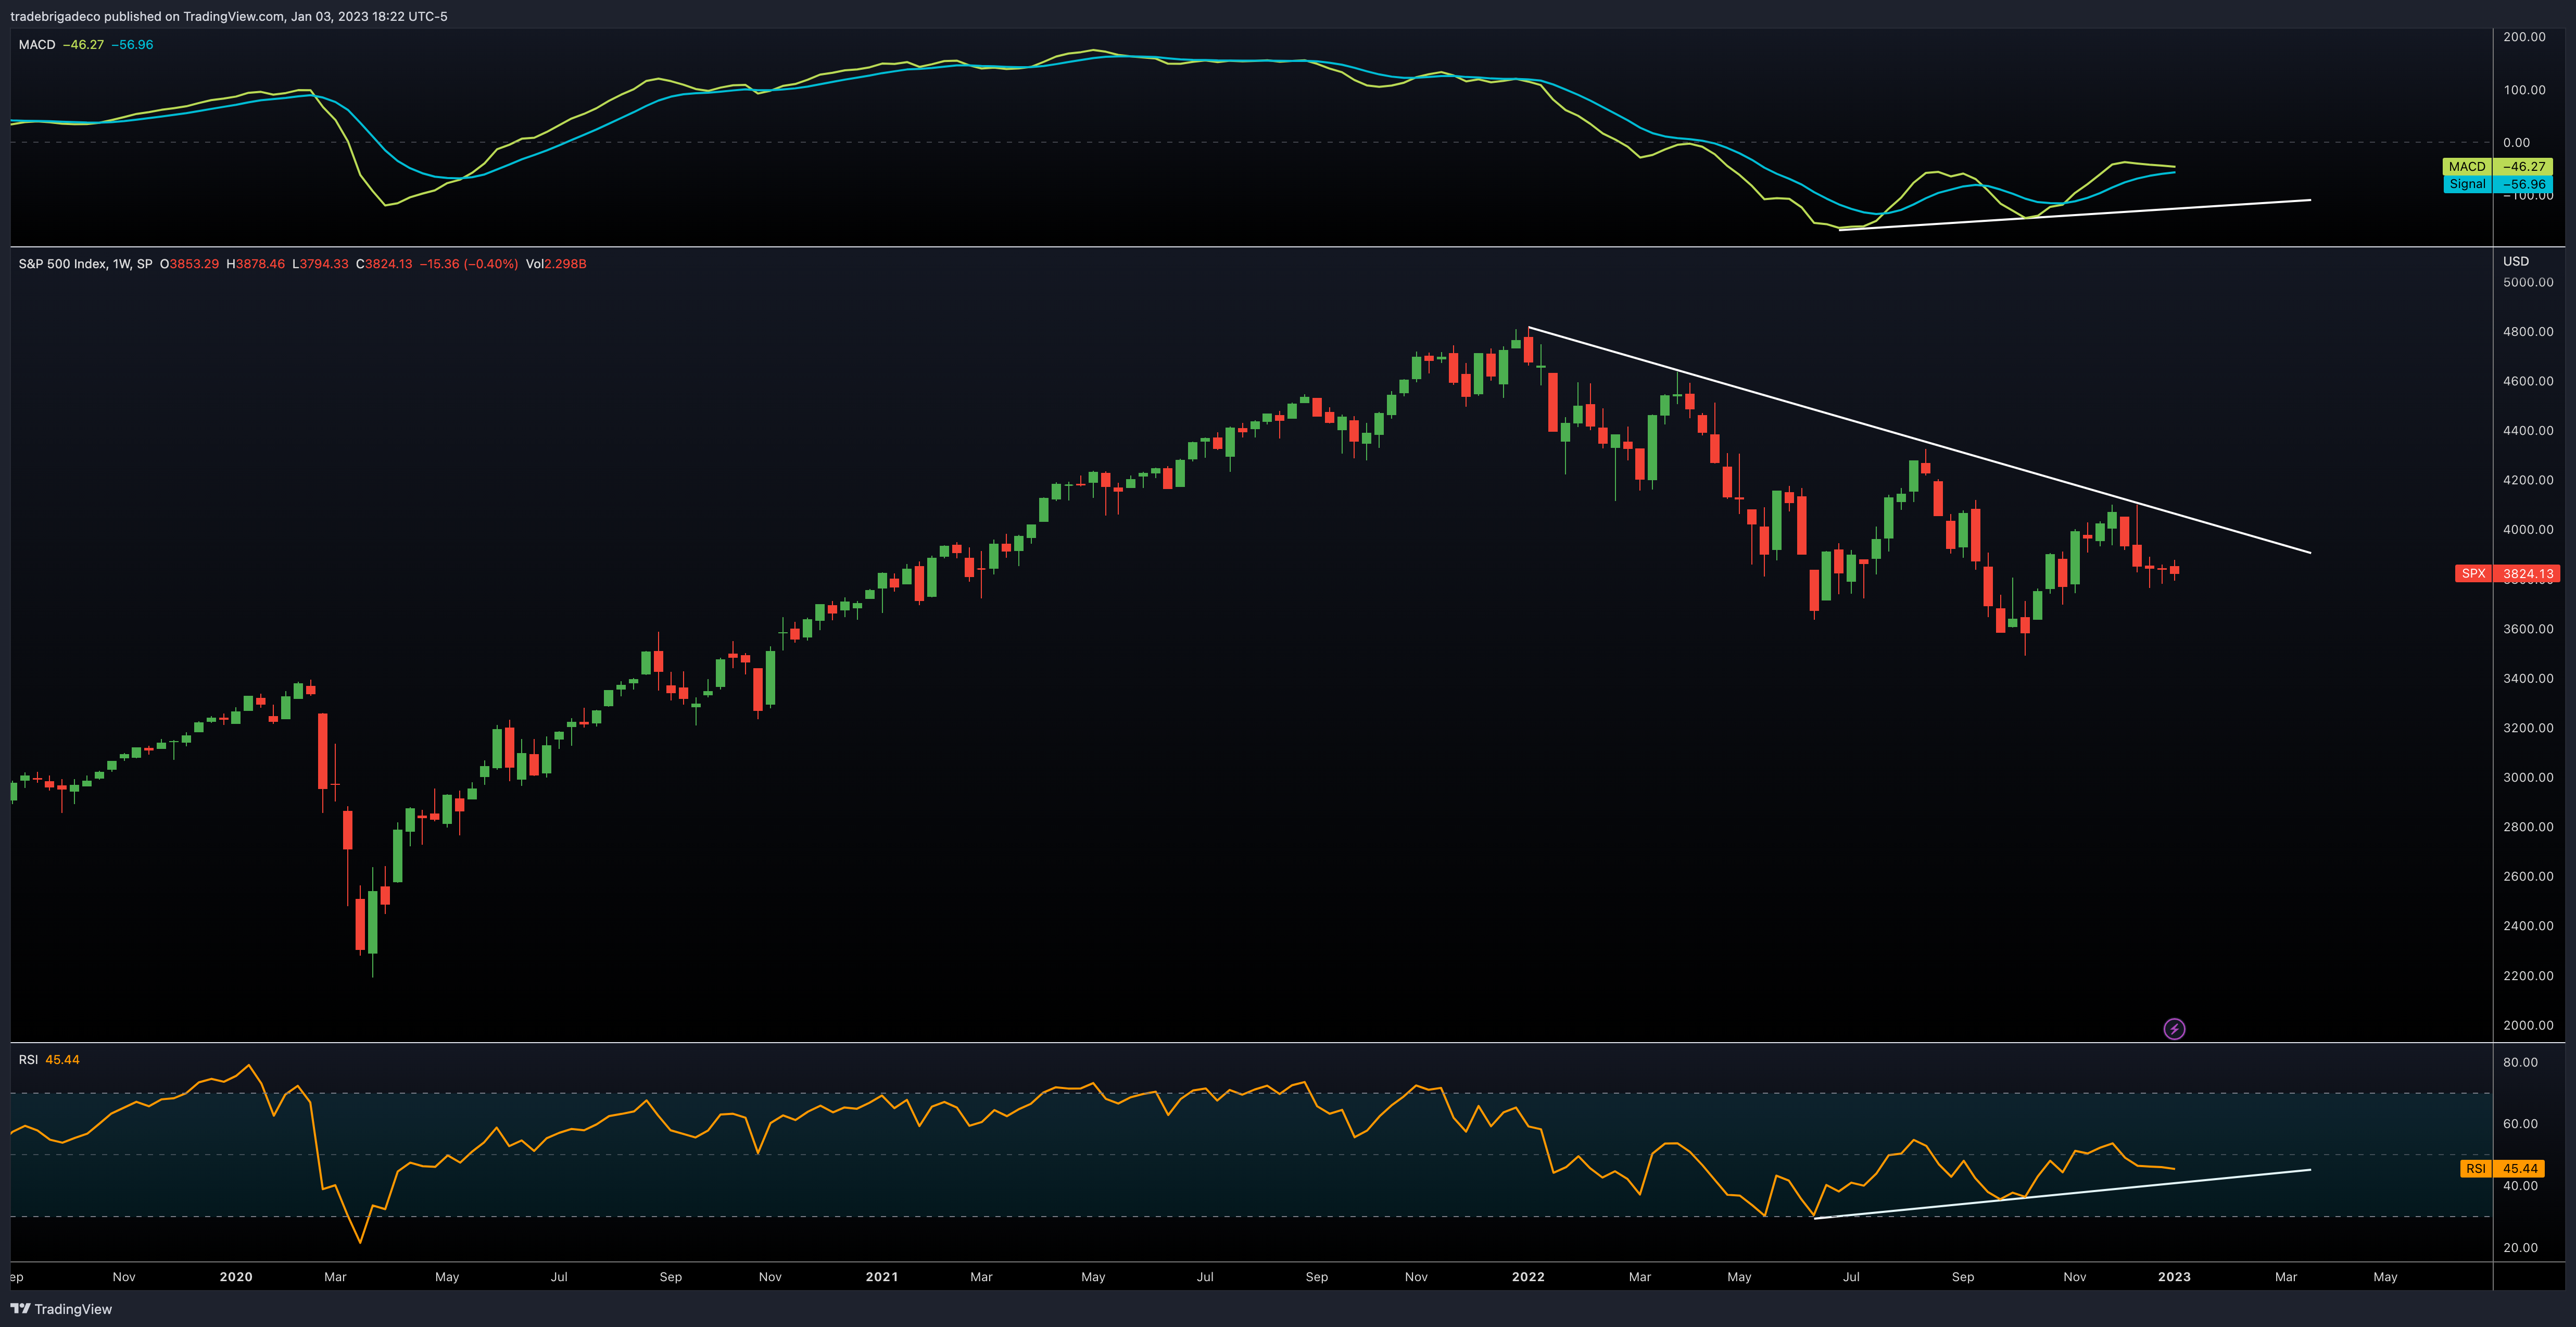 Figure 27
The eleven core sectors of the S&P 500 market have exhibited defensive posture into the close of the year and currently don’t show signs of reversing trend (Figure 28). Before increasing allocation to risk on, technology and consumer discretionary need to move higher on the relative performance list, and likewise energy, utilities and consumer staples lower.
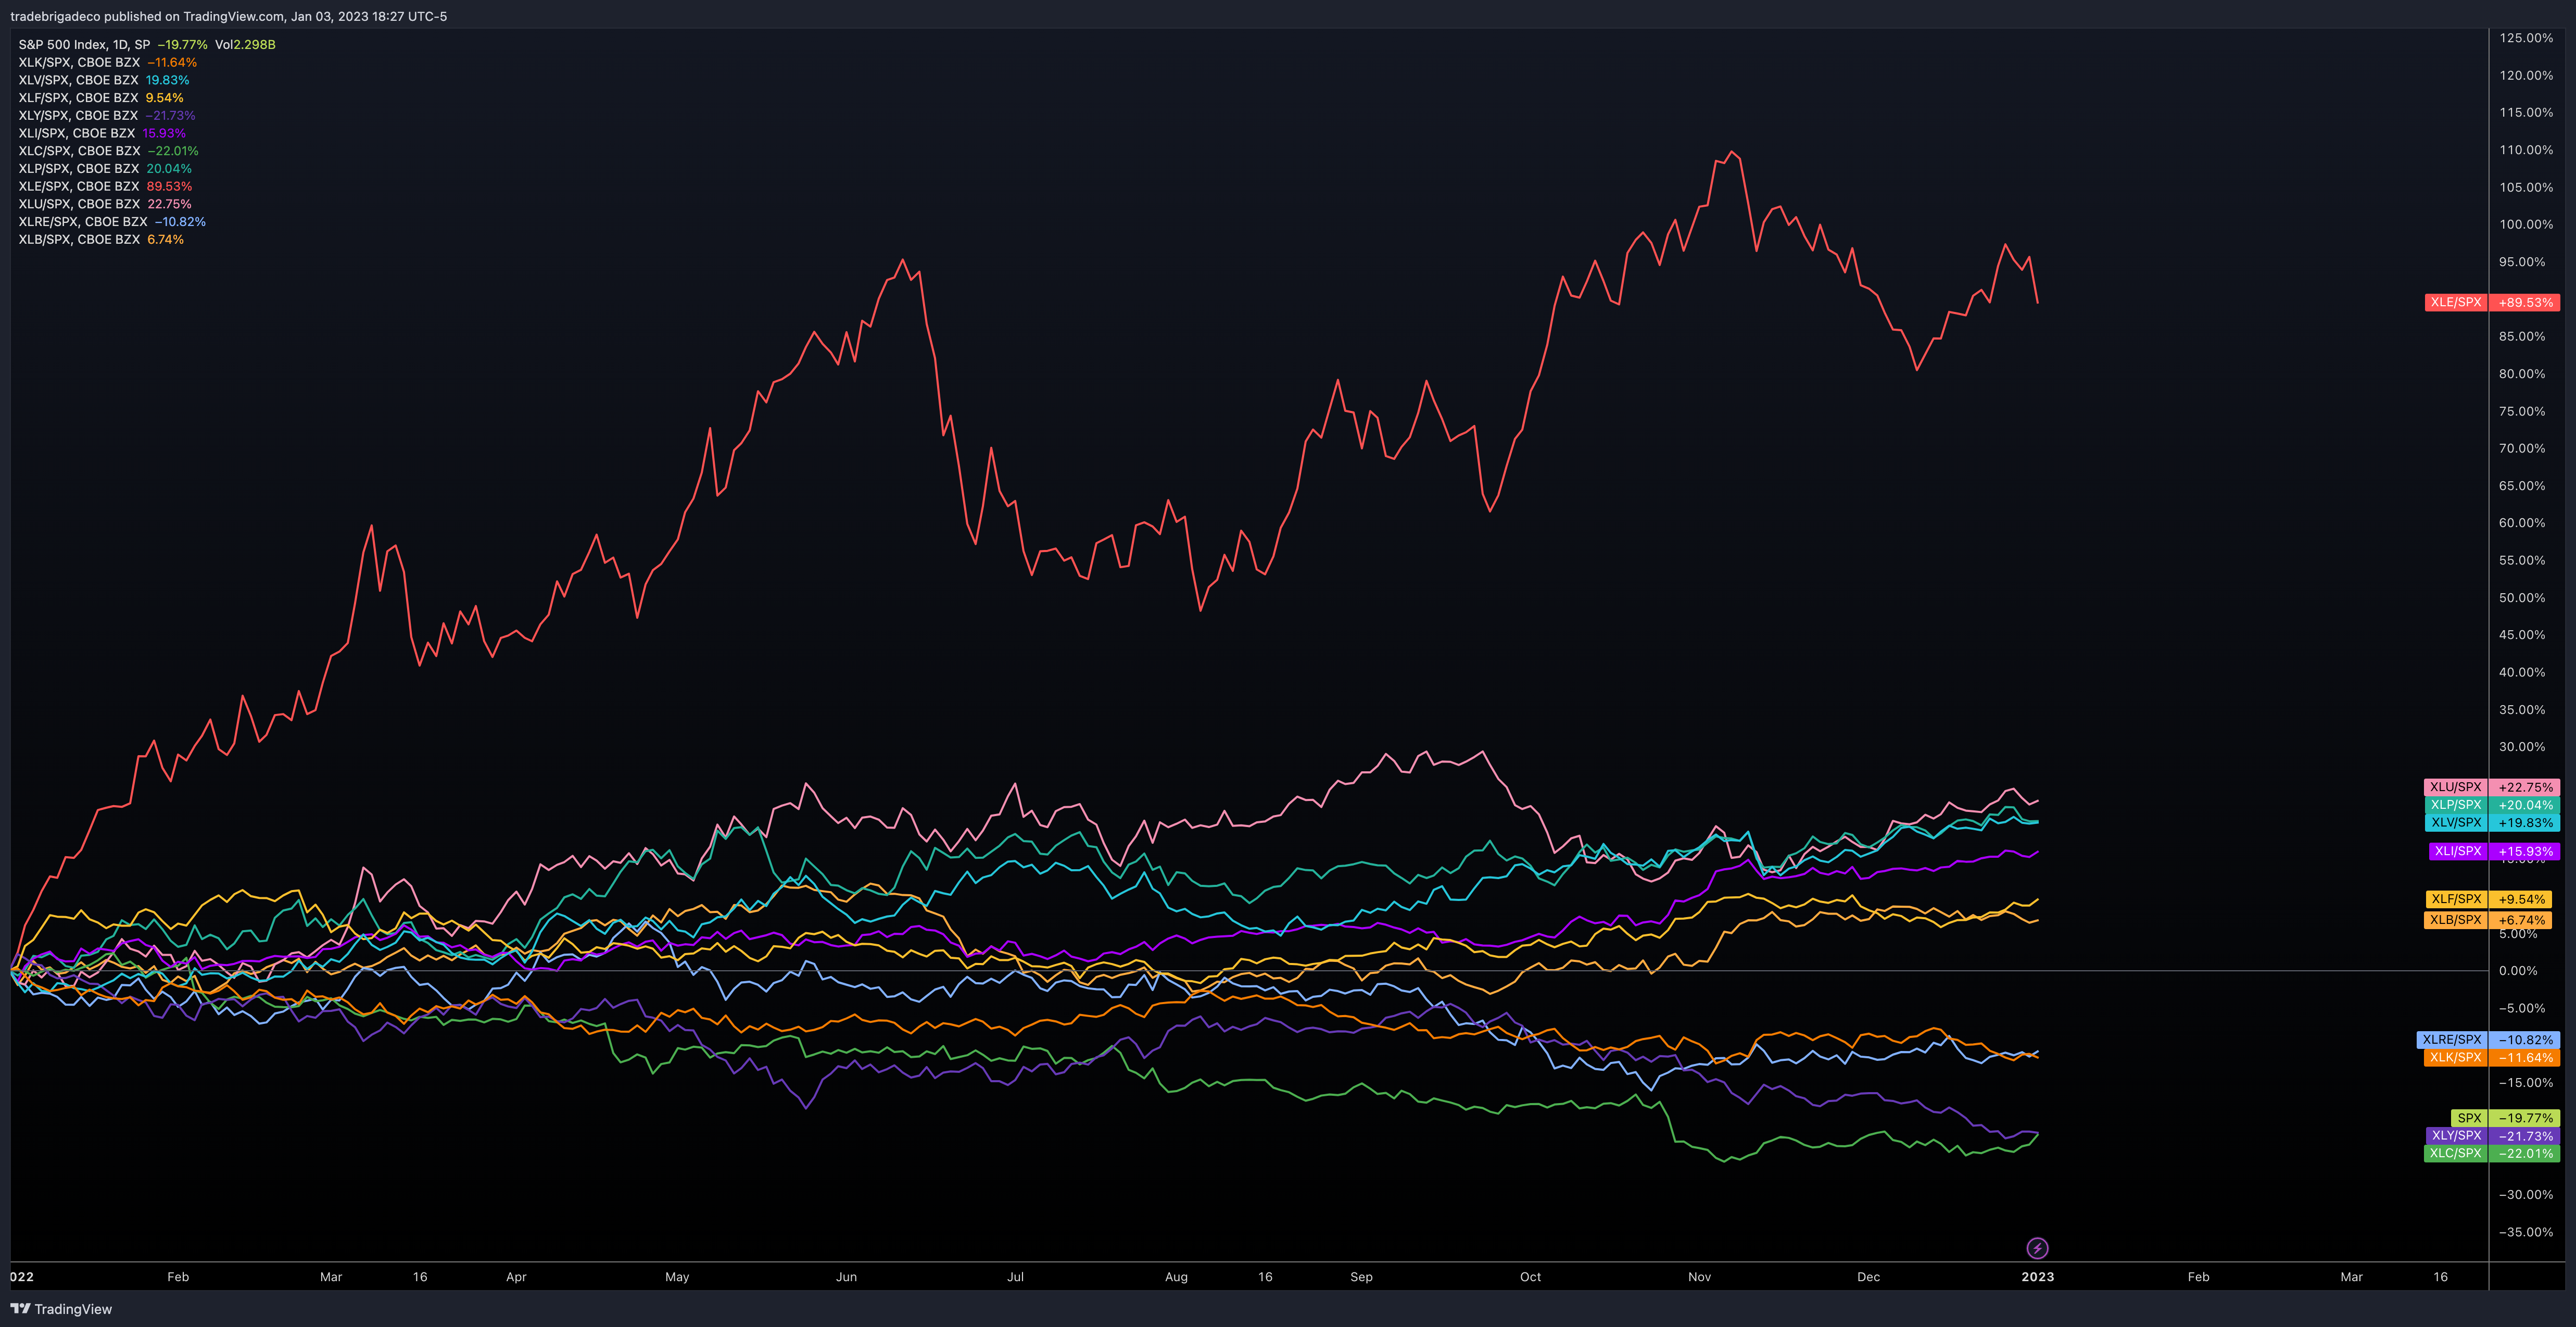 Figure 28
Conclusion
In summary, the possibility of outcomes in the coming year are wide and subject to change based on new information as it is released. The purpose of this exercise is to understand the larger challenges for the market, and be able to identify the conditions that start to signify a change in tone. The big themes we will be tracking for 2023 include equity valuations, policy lags, labor force participation rates, and de-globalization.
The forecasted range based on multiple valuation possibilities puts the S&P 500 somewhere between 2868 – 4700. Noting the aforementioned headwinds, expecting the lower part of the range in the first half of the year and the upper part of the range in the second half of the year, should there be improvements, appears reasonable.
From a technical perspective, the market has greater downside odds failing support around the 3400 zone, and greater upside odds breaking the resistance around 4150. There are some positive divergences playing out in momentum indicators, but under the hood, defensive posturing reigns supreme.
